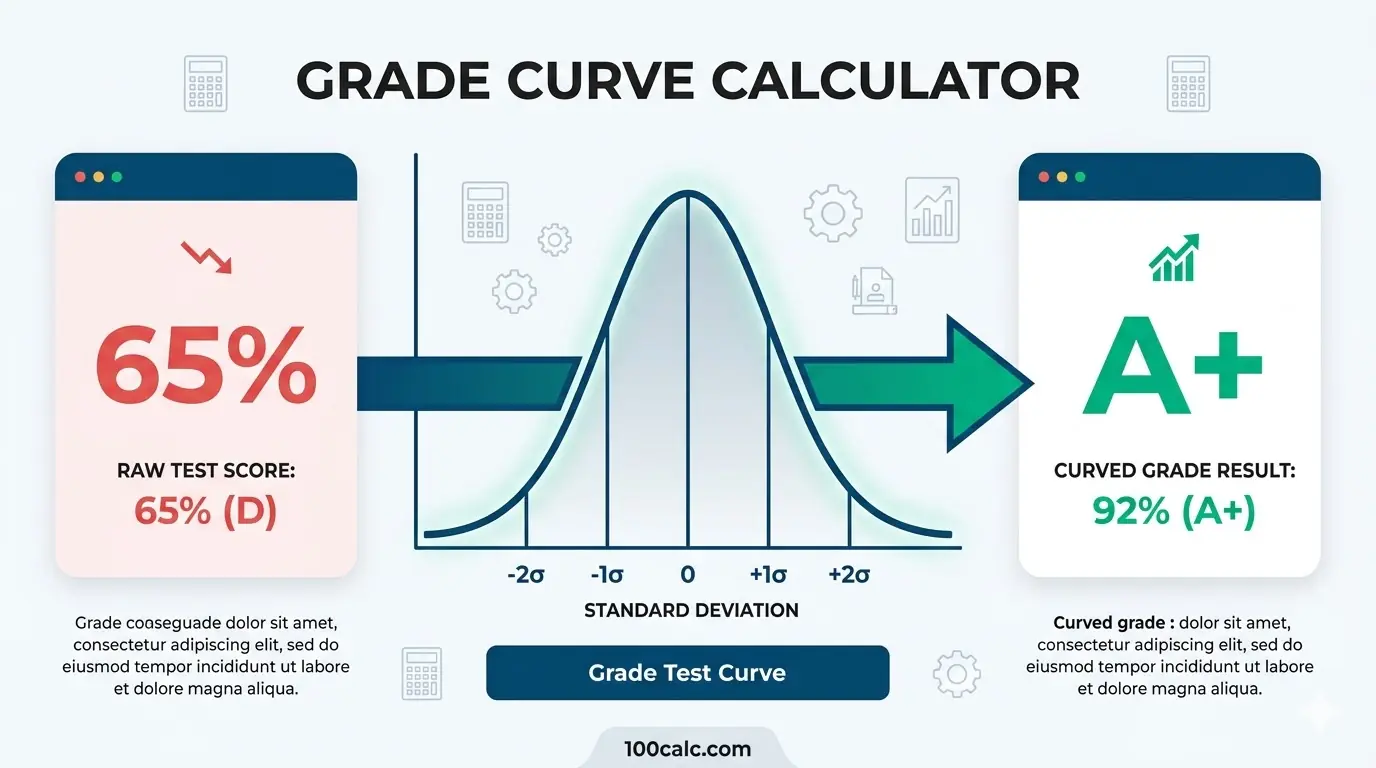
Grade Curve Calculator: Boost Your Score Fast
Do you need to adjust a test score? You can easily fix low test results with our tool. Our free online grade curve calculator changes grades based on overall class performance. Therefore, grading on a curve is now very simple. You do not need a confusing grade curve calculator excel file. Instead, our system handles the math for you. First, choose if you are a student or a teacher.
Next, pick from five popular methods. For example, you can use a flat point boost or a square root curve. Also, teachers can use the true bell curve calculator. This specific method uses the class average and standard deviation to balance scores. Finally, just enter your raw score to see your new letter grade.
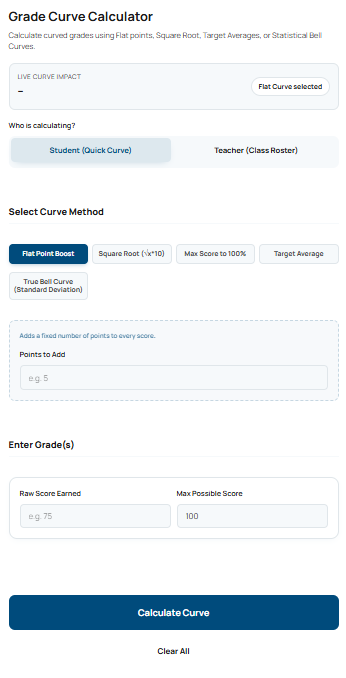
Grade Curve Calculator
Calculate curved grades using Flat points, Square Root, Target Averages, or Statistical Bell Curves.
Adds a fixed number of points to every score.
Takes the square root of the raw percentage and multiplies by 10. (Great for STEM classes).
Shifts the highest score to 100% and adds that exact difference to everyone.
Shifts all grades up so the class average hits a specific target.
Forces grades into a normal distribution curve based on Z-Scores.
Curved Grade Result
Your mathematically adjusted score.
Best & Worst Case Scenario
If your teacher uses a different method, your -- becomes:
Class Roster (Before & After)
| Student | Raw % | Curved % | Grade |
|---|
- Raw Score Average
- 0.0%
- Curved Score Average
- 0.0%
- Total Shift (Delta)
- +0.0
How do you calculate a grade curve?
Grading on a curve adjusts scores to reflect relative performance rather than absolute performance. While a flat curve gives everyone the same boost, a bell curve calculator uses the mean and standard deviation to force grades into a normal distribution, commonly used as a law school grade curve calculator.
What is a score curved grade?
Based on your inputs, a raw score of a percentage curved using the selected method becomes an adjusted percentage. Whether you are a student predicting a final grade or a teacher using an excel grade curve calculator, this represents your adjusted academic standing.
Grade curve methods explained (which one should you use?)
Not all grade curves work the same. Some simply add points, while others completely reshape class performance using statistical models. Choosing the right curve depends on your goal — boosting everyone slightly, fixing a tough exam, or normalizing scores across a class.
| Method | How It Works | Best For | Impact Level |
|---|---|---|---|
| Flat Curve | Adds the same points to every student | Small exam fixes | Low |
| Square Root Curve | Boosts lower scores more than high scores | Difficult exams (STEM) | Medium |
| Max Score to 100% | Shifts highest score to 100% | Fair scaling across class | Medium |
| Target Average | Adjusts scores to hit a desired class average | Controlled grading | High |
| Bell Curve | Uses standard deviation to normalize distribution | Strict academic grading | Very High |
Tip: If you’re unsure, start with a flat curve. If the class performance varies a lot, a bell curve gives the most accurate adjustment.
What The Easy Grade Calculator Results Mean
The results from this easy grade calculator show more than just a simple number. They clearly explain the new academic standing. This section helps users understand the adjusted score, total shift, and new letter grade. Therefore, you can use these details to check final class rankings confidently.
Understanding Your Adjusted Score
The adjusted score reveals the final grade after mathematical changes. First, the tool takes a raw percentage. Then, it applies the chosen curving method. After that, it calculates the exact difference. This new number reflects the curved grade. As a result, students can easily see their true performance level.
How Class Performance Shifts Grades
Many curving methods depend heavily on the whole class. For example, a true bell curve calculator uses the class average and standard deviation. The tool finds the middle score first. Next, it moves everyone around that center point. As a result, a grade might go up. Sometimes, a curve can lower a high score. However, most teachers use an easy grade calculator method to boost everyone fairly.
Total Shift and Letter Grades
The total shift shows exactly how many points a student gained. Our online grade curve calculator highlights this difference clearly. For instance, a square root curve changes a 64 percent raw score into an 80 percent. Consequently, the letter grade jumps to a B minus. This exact breakdown helps users track progress easily. You do not need a complicated grade curve calculator excel sheet anymore.
Test The Tool With Real Examples
First, use the examples below to test the calculator. Then, enter the values exactly as shown. You can change them later to match specific easy grade calculator needs.
Example 1: STEM Class Test
Use this to test: Square Root Curve Feature
- User Intent: Student (Quick Curve)
- Select Curve Method: Square Root
- Raw Score Earned: 64
- Max Possible Score: 100
What you should see:
- The curved grade jumps to 80.0 percent.
- The letter grade becomes a solid B minus.
- The total shift shows a positive 16.0 point boost.
Example 2: Law School Class
Use this to test: Bell Curve with Mean Feature
User Intent: Student (Quick Curve)
Select Curve Method: True Bell Curve (Standard Deviation)
Class Mean (Average): 75
Standard Deviation: 10
Raw Score Earned: 85.5
Max Possible Score: 100
What you should see:
- The curved grade normalizes to 85.5 percent.
- The letter grade translates to a solid B.
- The results reflect a standard statistical distribution.
Explore More Calculators
Use our easy average grade calculator to find your exact class percentage. You can instantly compute weighted scores and predict your final exam grade.
Try calculatorStop guessing your semester average today. Use our final grade calculator to find exactly what test score you need to pass. Calculate your safe…
Try calculatorUse our free easy grade calculator to find exact test percentages and letter grades. It perfectly supports half points, custom scales, and teacher charts.
Try calculatorStop guessing your exam scores. Use our free Marks Percentage Calculator to find your exact academic grade. Instantly convert your marks to CGPA today.
Try calculatorStop guessing your class grade. Our unweighted grade calculator finds your straight average instantly. Convert percentages to a 4.0 GPA scale. Try it now!
Try calculatorStop guessing your Blackboard marks! Use our proven UQ grade calculator to instantly reveal what you need on your final exam before it's too…
Try calculatorHow to Use The Easy Grade Calculator
Using this tool is very simple. You only need your test scores. The easy grade calculator uses your raw numbers to find your new score based on standard academic formulas. Follow these five easy steps to get your result instantly.
Choose Your Role
Identify your exact need first. Select "Student (Quick Curve)" for a fast personal prediction. Alternatively, select "Teacher (Class Roster)" to enter multiple students at once. This step is crucial because the teacher mode unlocks a full class table.
Select The Curve Method
Next, pick your preferred math formula. You can choose between Flat Point, Square Root, Max Score, Target Average, or True Bell Curve. Every method shifts the grades differently. Therefore, you should try a few options to see the variations.
Enter Baseline Metrics
Now, input the necessary class data. For example, you might need the class average or standard deviation. You only need these numbers if you use the grade curve calculator with standard deviation. Otherwise, you can skip this specific part.
Input Your Grades
Enter the raw score you earned. Then, enter the maximum possible score for the test. Since the tool converts points into a flat percentage, try to be very precise. Teachers can also add student names in this section.
View Results Instantly
Finally, hit the calculate button. The results panel will instantly display your adjusted percentage and letter grade. Students will also see a best and worst-case scenario matrix. You can now use this grade curve calculator result to verify your academic standing.
Quick Formula Used
Flat Boost: Raw Percentage + Bonus Points
Square Root: Square Root of Raw Percentage × 10
Bell Curve: 75 + (Z-Score × 10)
Why This Process Is Accurate
This method matches real school grading policies perfectly. It calculates the true adjusted grade based on actual math. As a result, your estimate accurately reflects reality.
Try It Yourself
- First, enter your raw score and the max points.
- Next, select the square root method to see a massive point boost.
- Then, switch to the target average method to see how the number changes.
- You will instantly see why different curving methods create entirely different final grades.
Average Grade Calculator Formulas Explained
This section explains exactly how our tool adjusts your test score. It reveals the math behind point boosts, averages, and statistical curves. Because teachers use different grading rules, we calculate your new grade using five distinct methods. This helps you understand where the numbers come from. Therefore, you can see why accuracy depends on precise inputs.
First, we start with your raw percentage. Then, we apply your chosen mathematical rule. Finally, we adjust for class performance.
The Curve Formulas
These formulas power the average grade calculator. They convert your raw score into a higher curved grade.
The Formula:
					Flat Point Boost: Curved = Raw Percentage + Bonus Points

Square Root Curve: Curved = √(Raw Percentage / 100) × 100

Max Score to 100%: Curved = Raw Percentage + (100 - Highest Class Score)

Target Average: Curved = Raw Percentage + (Target Average - Current Class Average)

True Bell Curve: Curved = 75 + (((Raw Percentage - Class Mean) / Standard Deviation) × 10)
These formulas rely on key variables. Each variable comes directly from your input or class standards.
Variable 1: Class Mean (Average)
First, we determine the baseline performance of the whole class. The class mean is the average raw score of all students. You must know this number to use a grade curve calculator with mean settings. It acts as the center point for shifting grades.
Variable 2: Standard Deviation
Next, we measure the score distribution. Standard deviation shows how spread out the scores are from the mean. A small number means most students scored near the average. A large number means the scores are scattered. You need this specific metric to use a true bell curve calculator.
Variable 3: Target and Max Scores
Finally, some methods use simple differences. The max score variable looks at the smartest student in the room. The formula finds the gap between their score and 100 percent. Then, it adds that exact gap to everyone.
Example Calculations You Can Test
Use these exact inputs to test the average grade calculator logic. We show the math step-by-step. Therefore, you can see exactly how raw points turn into a higher letter grade.
Example 1: The MIT STEM Square Root Curve
A student takes an advanced calculus class at a highly competitive university like MIT or UC Berkeley.
Given:
Curve Method: Square Root
Raw Score Earned: 72 percent
Calculation:
					Step 1: Convert the raw percentage to a decimal.

72 / 100 = 0.72

Step 2: Find the square root of that decimal.

√0.72 = 0.8485

Step 3: Multiply by 100 to get the new percentage.

0.8485 × 100 = 84.85
Result:
Estimated Grade: 84.8 percent.
The original failing score translates to a solid B. You will see this exact number in the result panel. This method heavily favors rigorous STEM classes.
Why This Formula Matters
These formulas show the true potential of your test performance. First, they remove unfair grading gaps. Second, they use standard math instead of random guesses. Therefore, the average grade calculator gives you a highly accurate estimate of your final score. Because of this, your curved result might look very different from your raw test score. However, this new number reflects your true class standing. Finally, you now have a reliable baseline before your teacher posts the official grades.
Understanding Your Curved Grade Results
Your average grade calculator results show more than just a new score. Instead, they help you understand your true academic standing in different classes. Furthermore, teachers and students use specific curve methods for different needs. Therefore, here is a quick breakdown to help you read your results and understand standard grading rules.
| Curved Percentage | Standard Letter Grade | Meaning |
|---|---|---|
| 97% to 100% | A+ | Exceptional Performance |
| 90% to 96% | A / A- | Excellent |
| 80% to 89% | B+ / B / B- | Good / Above Average |
| 70% to 79% | C+ / C / C- | Satisfactory / Average |
| 65% to 69% | D+ / D | Passing, but Below Average |
| Below 65% | F | Failing / Unacceptable |
Important: These letter grades represent standard US College Board mapping. Individual professors or university departments may adjust this scale based on specific syllabus rules.
How to Read This Table With the Calculator
First, enter your raw test score into the average grade calculator above. Note your new curved percentage. Now, compare your calculated result against the Curved Percentage column. Next, match it with the Standard Letter Grade row. This comparison acts as a quick reality check. It tells you immediately if your adjusted score meets standard academic rules. For example, students at Stanford University or NYU use this exact grading scale for their classes.
What This Means For You
If your calculator result falls inside the green zone, you have an excellent grade. If your result drops below 65 percent, you have a failing score. This clear table helps you avoid bad surprises on report card day. If you are a student, you know exactly what your final grade looks like. If you are a teacher, you can quickly spot if your grade curve calculator standard deviation is too harsh. Sometimes, a strict math curve hurts the whole class. Therefore, you can adjust the settings before posting official grades.
Quick Example Using the Table
Inputs:
Curve Method: Target Average
Current Class Average: 65
Target Average: 75
Raw Score Earned: 70
Results you will see:
Calculator Result: 80 percent
Table Range: 80 percent to 89 percent (B tier)
Since 80 percent fits perfectly inside the B range, you can feel confident about your new academic standing.
Insights and Smart Recommendations
Use your average grade calculator results to make smarter academic decisions. Understanding how different math formulas affect final scores helps you set realistic goals. Compare your calculator result with different curve methods. This helps you confirm if your grade is safe or in danger. These insights help you act with confidence when studying for finals or managing a classroom.

How Teachers Should Use Standard Deviation
You might wonder which method works best for a large group. Teachers should use the grade curve calculator with standard deviation for classes with over 30 students. This specific true bell curve method ensures a perfectly fair grade distribution.
As a result, this prevents massive grade inflation. It logically stops everyone from getting an easy pass on a simple test. Furthermore, a class grade curve calculator balances the hardest exams perfectly. Always check the math before you post the final grades.
Why Students Must Prepare For The Worst
Students must never assume a curve will automatically save a failing grade. Sometimes, a strict professor will not curve the test at all. Therefore, you should always study hard for every single exam.
Instead of guessing, use the best and worst-case scenario matrix inside our tool. This feature shows exactly what happens under different grading rules. A grade calculator based on curve logic helps you prepare mentally. Consequently, you will not face any bad surprises on report card day.
Why Consistency Matters All Semester
Teachers must choose one curving method at the very start of the semester. You need to stick to this exact rule all year. This strict consistency maintains complete grading integrity.
Changing grading rules halfway through the year confuses students. If you use a custom grade curve calculator, put the formula directly in your syllabus. Then, students can use our online grade curve calculator to track their own progress. Ultimately, clear rules create a much better classroom environment.
You Might Also Find These Helpful
Grades 7
Stop guessing your class average! Use our free weighted grade calculator to instantly factor in extra credit, points, and see exactly what you need…
Try calculatorCommon Mistakes When Calculating Curves
Calculating curved grades requires precise inputs. Small errors often lead to massive differences in the final score. This average grade calculator relies on your data to apply the correct math. Below are the most common mistakes users make. Reading this helps you get the most accurate curve possible.
- Using Mean Instead of Median: Confusing the mean and median is a massive error. The mean is the normal class average. Meanwhile, the median is the exact middle score. A grade curve calculator with median settings works differently than a curve grade calculator with mean settings. Therefore, you must choose the exact right metric for your target shift.
- Ignoring the Max Possible Score: Many users completely ignore the maximum test points. They try to calculate a curve on raw points directly. However, you must convert points into a flat percentage first. Otherwise, your final number will be totally wrong. Always enter the max possible score into the tool.
- Using a Bell Curve for Small Classes: Teachers often misuse standard statistical formulas. A true bell curve needs a very large sample size. Therefore, using it on a tiny class of five students is a bad idea. This mistake distorts the final grades unfairly. Instead, use a simple flat boost or a target average for small rosters.

Frequently Asked Questions (FAQs)
How do you calculate a grade curve?
To calculate a grade curve, you first need to pick a specific math formula. Most teachers use a flat point boost or a square root method. Next, you apply this rule to your raw test score. As a result, your final percentage increases.
You can do this math manually. However, using our average grade calculator saves time and prevents annoying math errors completely.
What is a square root curve?
A square root curve is a popular grading method for very difficult math and science exams. First, you take the square root of your raw decimal score. Then, you multiply that result by ten. Consequently, low scores receive a massive point boost.
For example, a failing grade of 64 percent instantly becomes an 80 percent. Therefore, many rigorous college classes prefer this specific curving technique.
What does grading on a curve mean?
Grading on a curve means adjusting student test scores based on overall class performance. Teachers use this method when a test is extremely hard. Instead of failing everyone, the professor mathematically shifts all grades higher. This ensures a much fairer final class average.
For instance, if the highest class score is an 85 percent, the teacher might boost everyone by 15 points. Therefore, the top student gets a perfect 100.
Can a grading curve lower my score?
Yes, a grading curve can sometimes lower your score. This usually happens when a teacher uses a true bell curve calculator. If the test was very easy, the class average naturally shifts higher. As a result, the formula might push your top score down.
However, most teachers avoid this strict method. Instead, they use a flat curve grade calculator to only add bonus points to your raw score.
How does a flat scale curve work?
A flat scale curve simply adds the exact same number of bonus points to every student. For example, a teacher might add five points to everyone after a hard test. This method is incredibly easy to understand.
Furthermore, it helps everyone equally. Students love this simple method. You can easily test this logic using our online grade curve calculator to see your predicted final score.
When should teachers use a bell curve?
Teachers should strictly use a bell curve for massive university lecture classes. This specific method requires a very large sample size to work fairly. First, it finds the average mean. Next, it distributes all other scores evenly around that exact center point.
You should never use a grade curve calculator with standard deviation for a tiny class. Doing so will completely distort the final academic grades.
Questions?
We had love to hear from you! Whether you are reporting an issue, suggesting a new calculator, or exploring collaboration opportunities — we are here to help. Every message helps us make 100calc smarter, faster, and more helpful for everyone.
Why People Trust 100calc
At 100calc.com, we focus on accuracy, speed, and trust. Every calculator we create is designed to give reliable, instant, and easy-to-understand results you can truly depend on.