Price Elasticity of Demand Calculator With Formula and Examples
A price elasticity of demand calculator measures how demand changes when price changes. It uses the midpoint formula to calculate elasticity, show market sensitivity, and estimate revenue impact. Enter price and quantity values to get an instant PED score and demand classification.
Understanding elasticity helps you make better pricing decisions. A small price change can increase or reduce total revenue depending on demand behavior. This tool calculates elasticity, compares scenarios, and shows whether demand is elastic, inelastic, or unitary using real data.
- Updated Jun 16, 2026
How to Calculate Price Elasticity of Demand With Example
Want to see how the calculator works before you enter your own numbers? Start with the worked examples below. Each one uses real inputs, the price elasticity of demand formula, and the midpoint formula logic built into your calculator. This helps readers understand price sensitivity, demand response, revenue change, and market behavior in a simple way.
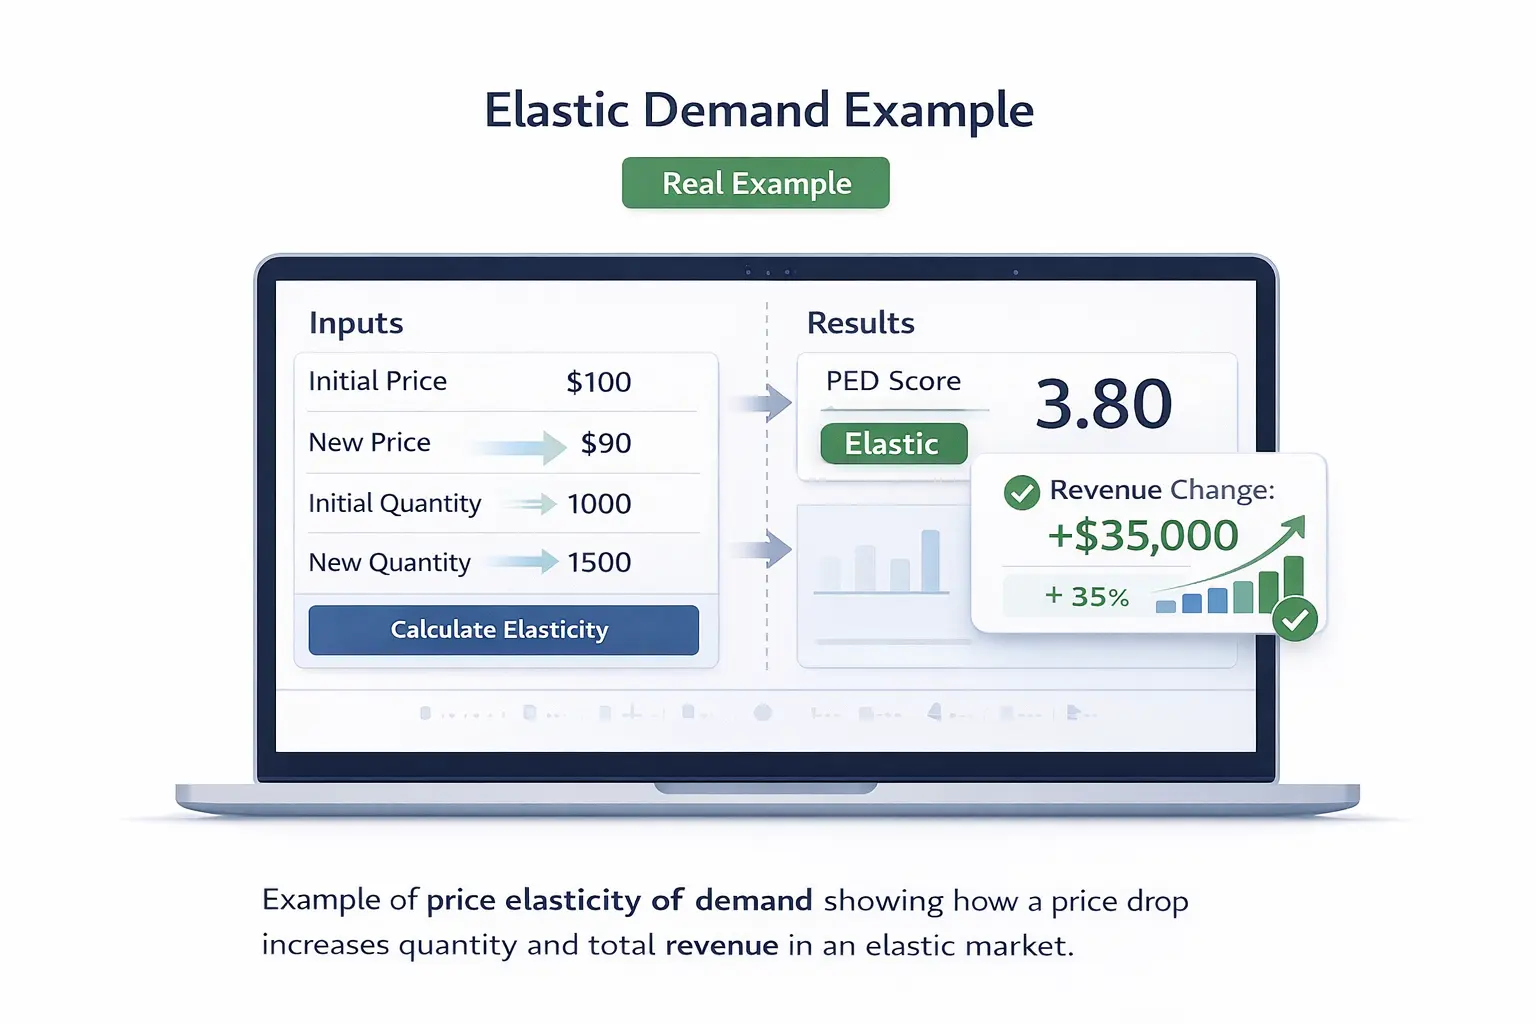
What happens when price drops from $100 to $90 and quantity jumps from 1,000 to 1,500?
This is a strong elastic demand example. A lower price leads to a large rise in quantity demanded, so buyers react strongly to the change.
Use these inputs in the calculator:
- Target Country: United States ($)
- Initial Price: 100
- New Price: 90
- Initial Quantity: 1000
- New Quantity: 1500
Expected output:
- PED Score: 3.80
- Revenue Change: +$35,000
- Revenue Growth: 35.0%
- Initial Revenue: $100,000
- Final Revenue: $135,000
- Market Type: ELASTIC
- Status: LOCALIZED
Expected interpretation:
Demand is elastic. Buyers in this example respond strongly to the price cut. Revenue rises because the gain in quantity is larger than the loss in price.
What happens when price rises from ₹50 to ₹55 and quantity falls from 1,000 to 950?
This is a good inelastic demand example. Price goes up, but quantity falls by a smaller percentage. That tells you demand is less sensitive.
Use these inputs in the calculator:
- Target Country: India (₹)
- Initial Price: 50
- New Price: 55
- Initial Quantity: 1000
- New Quantity: 950
Expected output:
- PED Score: 0.54
- Revenue Change: +₹2,250
- Revenue Growth: 4.5%
- Initial Revenue: ₹50,000
- Final Revenue: ₹52,250
- Market Type: INELASTIC
- Status: LOCALIZED
Expected interpretation:
Demand is inelastic. Buyers still purchase close to the same quantity even after the price increase. Revenue goes up because the higher price offsets the small drop in sales volume.
What happens when price drops from £10 to £8 and quantity rises from 100 to 125?
This is a clean unitary elasticity example. It is useful because revenue stays the same when the percentage change in quantity matches the percentage change in price.
Use these inputs in the calculator:
- Target Country: United Kingdom (£)
- Initial Price: 10
- New Price: 8
- Initial Quantity: 100
- New Quantity: 125
Expected output:
- PED Score: 1.00
- Revenue Change: £0
- Revenue Growth: 0.0%
- Initial Revenue: £1,000
- Final Revenue: £1,000
- Market Type: UNITARY
- Status: LOCALIZED
Expected interpretation:
Demand is unitary. Total revenue does not change. This is a useful benchmark when teaching price elasticity of demand percentage and revenue behavior together.
Important QA note:
The score and revenue values should match. However, your current script may still show the inelastic-style market tip in this exact unitary case. That happens because the strategy message only splits between greater than 1 and less than 1. If you want, we should patch that next.
What happens when price rises from ₨200 to ₨240 and quantity falls from 800 to 500?
This example shows an elastic market with a price increase. It is useful because it proves that raising price can hurt revenue when buyers are highly responsive.
Use these inputs in the calculator:
- Target Country: Pakistan (₨)
- Initial Price: 200
- New Price: 240
- Initial Quantity: 800
- New Quantity: 500
Expected output:
- PED Score: 2.54
- Revenue Change: -₨40,000
- Revenue Growth: -25.0%
- Initial Revenue: ₨160,000
- Final Revenue: ₨120,000
- Market Type: ELASTIC
- Status: LOCALIZED
Expected interpretation:
Demand is elastic. Buyers cut back sharply after the price increase. Total revenue falls because the drop in quantity is too large.
Explore More Calculators
Find your true cost per unit in seconds. This Average Variable Cost Calculator shows your pricing floor and warns when each sale starts losing…
Try calculatorUse the Comparative Advantage Calculator to compare opportunity costs, find who should specialize, and avoid the table mistakes that flip answers.
Try calculatorUse this cross price elasticity calculator to see if products are substitutes or complements. Get instant results, % changes, and clear market insights in…
Try calculatorUse this High Low Method Calculator to find variable cost per unit, fixed cost, and projected total cost fast for budgeting, pricing, and planning.
Try calculatorUse this marginal cost function calculator to find cost per unit instantly. Enter change in cost and output to make smarter pricing decisions fast.
Try calculatorUse this marginal revenue calculator to find profit per unit fast. Compare cost, revenue, and output to make smarter pricing decisions instantly.
Try calculatorExplore Related Tools
How Should You Calculate Price Elasticity of Demand From a Table?
If your numbers come from a table, the best method depends on how the data is presented. Some users only have two price points. Others have a full demand schedule or a demand function. This comparison helps you choose the right approach fast and avoid wrong elasticity results.
| Method | Best for | Accuracy Level | Smart Note |
|---|---|---|---|
| Midpoint Formula | Two price and quantity points | High | Best choice for this calculator. It reduces bias when price and quantity both change. |
| Demand Table | Rows of prices and quantities | Good | Pick two matching rows carefully. Wrong row pairs can distort the elasticity result. |
| Demand Function | Equation-based economics problems | High | Useful when your class gives a formula instead of a table. Solve quantity first, then compare points. |
| Percentage Change Method | Quick rough checks | Lower | Fast, but less reliable than the midpoint formula. Good for estimates, not precise analysis. |
Smart note: If your table has uneven jumps in price or quantity, use two points that reflect the exact change you want to study. For the cleanest result, use the midpoint formula instead of a basic percentage method.
What Your Elasticity Result Means
First, our Price Elasticity of Demand Calculator determines your exact customer sensitivity safely. Next, you might wonder what your specific numbers mean completely. Consequently, your final result protects your corporate revenue perfectly. Therefore, you easily discover your true pricing power safely. Ultimately, we break down your exact demand score and revenue changes below completely.
Understanding Your PED Score
First, you must determine your real customer reaction to safe pricing. Next, a smart manager uses the exact score to avoid losing buyers safely. Furthermore, the final number sets your true market boundary perfectly. Consequently, you can safely measure the exact sales drop from your new price. Therefore, you use your exact demand score to set safe revenue goals.
Tracking Your Revenue Change
First, you deserve a clear picture of your sales risks. Next, our midpoint method calculator features a special revenue tracker perfectly. Furthermore, the mathematical check shows the exact raw cash your product creates completely. Consequently, comparing old sales to new sales creates a highly accurate cash report safely. Ultimately, the adjusted data accurately reflect your true financial growth.
Result Breakdown:
- Market Type: First, we fully display your exact buyer behavior. Next, the specific classification reveals if your buyers are highly sensitive to safety. Consequently, you instantly know whether you sell an elastic or inelastic product.
- Initial vs Final Revenue: The digital tool also shows your total wealth shift in a safe way. Next, smart managers use the exact number to fully understand broad sales growth.
Strategic - Recommendation: Finally, we explain exactly how you should adjust future prices perfectly. Consequently, you understand exactly how your new product performs safely when you calculate price elasticity correctly.
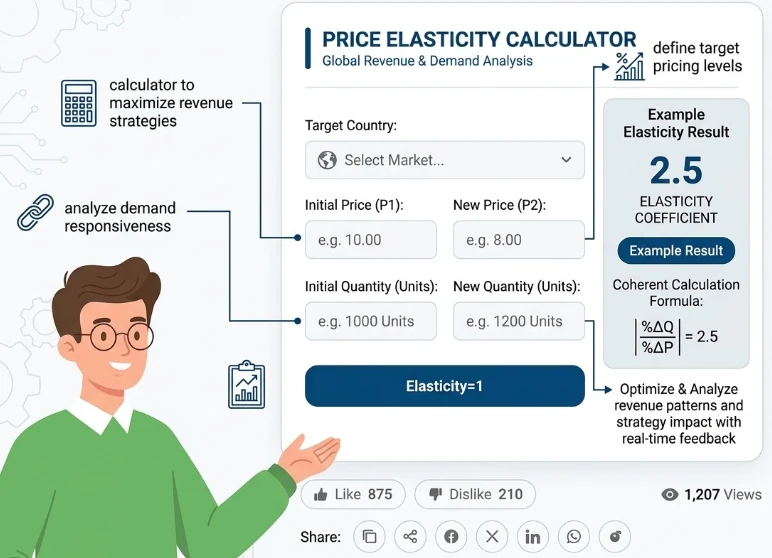
How to Use the Price Elasticity of Demand Calculator
First, calculating your exact product demand requires a clear financial process. Therefore, our digital tool uses four simple actions safely. Furthermore, you must follow these clear instructions carefully and perfectly. Consequently, you will learn how to calculate price elasticity safely. Let us start the exact calculation process right now, completely.
Select Your Target Country and Currency
First, click the top dropdown menu completely. Consequently, you must choose your exact market location safely. Our Price Elasticity of Demand Calculator uses your specific choice perfectly. Next, select your exact currency securely.
Enter Your Initial Product Price and Quantity
Next, enter your starting product price exactly. Specifically, set your exact original cost safely. Then, enter your normal units sold perfectly. Therefore, the digital application establishes your true baseline revenue completely.
Enter Your New Proposed Price and Expected Quantity
Furthermore, you must type your new planned price safely. Specifically, enter your exact updated cost completely. Next, type your expected new sales volume securely. Thus, the system accurately gathers all required demand numbers.
Review Your Final Demand Score and Revenue Impact
Finally, click the calculate button. Specifically, the system processes your numbers using the midpoint method calculator. Thus, you review the digital screen perfectly. Ultimately, you find your exact market sensitivity safely.
Example for testing
What happens when price drops from د.إ300 to د.إ270 and quantity rises from 200 to 280?
This example is great for checking the country and currency localization feature. It also shows another strong elastic case with a positive revenue outcome.
Use these inputs in the calculator:
- Target Country: UAE (د.إ)
- Initial Price: 300
- New Price: 270
- Initial Quantity: 200
- New Quantity: 280
Expected output:
- PED Score: 3.17
- Revenue Change: +د.إ15,600
- Revenue Growth: 26.0%
- Initial Revenue: د.إ60,000
- Final Revenue: د.إ75,600
- Market Type: ELASTIC
- Status: LOCALIZED
Expected interpretation:
Demand is elastic. The lower price attracts enough extra demand to lift total revenue. It also confirms that the calculator updates the selected currency symbol correctly.
How the Price Elasticity Formula Explained(Complete Breakdown)
First, understanding the mathematical formula builds your financial confidence perfectly. Next, the pricing equation gives you a clear picture of your exact expected demand safely. Furthermore, many beginners misjudge their market requirements.
Consequently, our Price Elasticity of Demand Calculator relies entirely on measuring your exact sales safely. Therefore, the internal logic ensures a highly accurate digital result for every manager.
Standard Midpoint Formula
First, the system securely verifies every single sales percentage. Furthermore, the digital tool accurately calculates your exact demand completely. Specifically, the program uses the midpoint method calculator logic for ultimate precision and safety.
Formula:
					Step One: Calculate the exact average price and average quantity completely. You can safely add the old and new numbers together. Then, you divide that total by two perfectly.
Step Two: Find the exact percentage change securely. You divide the raw change by your exact average number completely.
Step Three: Divide the quantity change by the price change safely. You find your exact elasticity score perfectly.
First, the digital tool applies these mathematical rules to your exact product completely. Next, the system protects your corporate revenue safely. Consequently, the program correctly finds your exact sales volume perfectly. Finally, the calculation outputs your exact safe pricing data. Therefore, simple math ensures a completely precise wealth strategy.
Example:
First, imagine evaluating the price of a new product in its entirety right now. Next, your initial price is exactly $100. Furthermore, your expected new price drops to exactly $90. Consequently, your initial sales volume is exactly 1,000 units. Then, your new sales volume jumps to exactly 1,500 units securely. Specifically, the system safely finds the exact price average of 95 dollars. Next, the system finds the exact average quantity of 1,250 units. Finally, you calculate price elasticity at exactly 4.75 safely.
Micro Note:
First, professional financial analysts use these exact mathematical rules to the letter. Next, applying their specific midpoint formulas ensures your official corporate revenue is protected. Furthermore, knowing your true customer demand helps you plan massive market sales safely.
Key Inputs Used in the Calculator
First, every financial calculation depends on your specific market variables safely. Next, your specific inputs help you pinpoint the exact expected revenue perfectly.
Price Change
First, your pricing shift accurately measures your exact profit speed. Furthermore, a massive price drop can completely erode your profit margin. Consequently, offering a massive discount results in a significant increase in sales volume. Therefore, you must strictly keep your expected pricing realistic and accurate.
Quantity Change
First, tracking your exact starting units ensures a highly accurate, safe final result. Next, exact product valuations rely entirely on that specific sales difference. Consequently, guessing a random setup volume results in your final demand valuation being entirely wrong. Therefore, you must safely apply the correct unit amounts to our digital system.
Another Example Calculation (Step-by-Step)
Check Your Value For Product Pricing
First, let us examine two common product pricing examples perfectly. Next, many managers want to track their exact expected demand safely. Furthermore, you often need to accurately predict your exact sales volume. Therefore, you can use these specific market examples to verify your own manual math securely. Consequently, the entire calculation process follows a simple financial rule.
Given:
- Initial Price: $50
- New Price: $55
- Initial Quantity: 1000 Units
- New Quantity: 600 Units
Calculation:
1: Find Averages: First, you calculate the exact price average safely. Next, you add fifty dollars and fifty-five dollars together completely. Furthermore, you divide that total by two securely. Your exact average price is $52.50. Consequently, you can safely calculate the average quantity. Specifically, your exact quantity average is exactly 800 units.
2: Calculate Changes: Next, you calculate your specific percentage changes securely. Specifically, you divide the five-dollar price change by your average price safely. Your exact price change is exactly 9.5%. Then you divide the 400-unit drop by your average quantity, and you get it perfectly. Your exact quantity change equals exactly fifty percent safely.
3: Find the Score: Finally, divide the quantity percentage by the price percentage. Your exact demand score equals exactly 5.26.
Result:
- First, your final score equals 5.26 safely. Next, the massive drop in sales completely destroys your total revenue. Consequently, your buyers react very strongly to small price hikes safely. Therefore, our Price Elasticity of Demand Calculator proves that you sell a highly elastic product perfectly.
Meaning:
First, you must recognize that your exact market risk requires highly strict safety measures. Next, you should expect professional managers to apply these exact pricing rules perfectly. Consequently, you turn a fast mathematical guess into a secure financial strategy right now, safely. Furthermore, strict digital documentation fully protects your exact corporate revenue. Usually, most successful companies use our digital tool to exclusively accept highly profitable price changes perfectly. Finally, you calculate price elasticity to constantly build lasting market wealth safely.
Standard Consumer Demand Benchmarks
First, you might wonder exactly how your customers react completely. Next, knowing standard demand numbers provides important pricing context perfectly. Consequently, you can instantly evaluate your exact product demand safely. Furthermore, your final pricing choice depends largely on these specific elasticity rules. Therefore, we break down standard elasticity spreads right here safely. Ultimately, you can accurately assess your exact revenue risk using our Price Elasticity of Demand Calculator.
| Market Category | Exact PED Score | Revenue Risk | Category Meaning |
|---|---|---|---|
| Perfectly Inelastic | Exactly Zero | Zero Risk | Consumers buy the exact same amount safely. Raise prices instantly completely. |
| Inelastic Demand | Less Than One | Low Risk | Buyers ignore small price jumps safely. Raising prices increases total revenue perfectly. |
| Unitary Elastic | Exactly One | Medium Risk | Revenue remains completely flat safely. Price changes cancel out quantity drops perfectly. |
| Elastic Demand | Greater Than One | High Risk | Buyers hate any price increase completely. Lowering prices captures more sales safely. |
Note: Next, you must remember your specific final revenue relies entirely on your exact calculated numbers safely.
Interpretation
First, a highly inelastic score perfectly captures extreme pricing safety. Next, an elastic score destroys your total market revenue completely during a price hike. Consequently, your specific product pricing remains highly protected completely for safe sales. Furthermore, you might have already priced some weak products safely. Conversely, a strict demand rule is perfectly embedded in every smart sales strategy. Our digital tool shows the exact sensitivity instantly. Additionally, many managers want to accurately and safely calculate price elasticity. We include your exact market type for extra context.
Pro Tip:
- Review Sales Health: First, you should try reviewing your exact unit projections right away, safely.
- Adjust Your Tracking: Next, changes in your specific market conditions can completely change your expected demand. Therefore, you must use the exact pricing inputs immediately and safely.
- Share the Numbers: Finally, you can share the confirmed midpoint method calculator results with your financial team perfectly. Consequently, applying the exact mathematical formula ensures you never lose your buyers’ safety.
Tips for Managing Your Product Pricing
First, you must carefully and thoroughly plan your pricing strategy. Next, smart managers protect their total market sales safely. Consequently, you avoid making dangerous pricing choices perfectly. Furthermore, you can use our Price Elasticity of Demand Calculator to test new ideas securely. Ultimately, applying these expert tips guarantees a much safer corporate future.
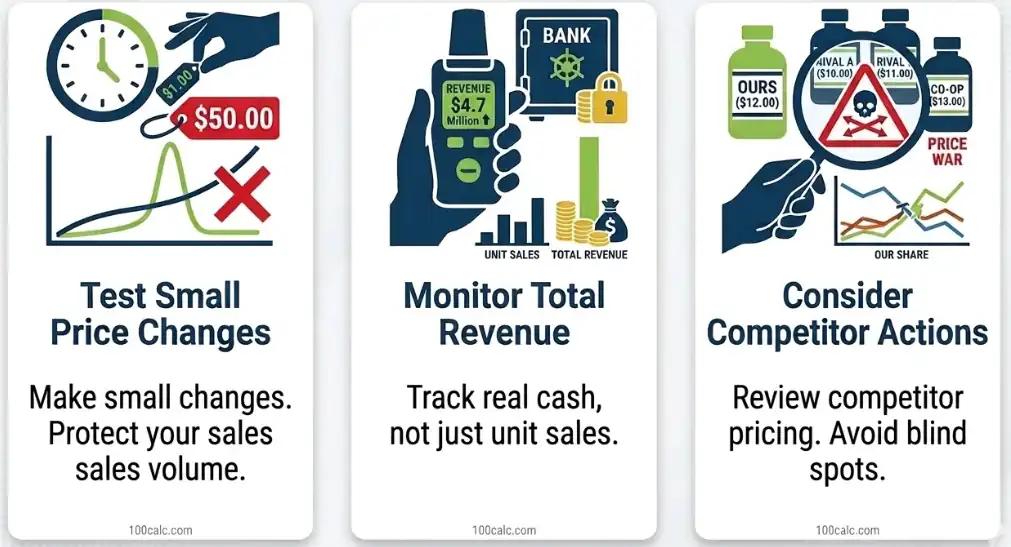
Test Small Price Changes
First, you must apply tiny price bumps to your products completely. Next, small changes help protect your baseline sales volume. Furthermore, shocking your buyers with massive price jumps destroys revenue perfectly. Consequently, a sudden price hike might chase away loyal customers. Therefore, strictly testing small amounts protects your money completely. Ultimately, you calculate price elasticity accurately when you move prices slowly and safely.
Monitor Total Revenue
First, your final corporate wealth depends entirely on your total cash safety. Next, many managers focus strictly on unit sales. Furthermore, selling massive units at a tiny price ruins your profit perfectly. Consequently, you must track the final bank deposit safely. Therefore, you must use the exact midpoint method calculator to accurately track your revenue. Ultimately, tracking pure cash shows your true market success safely.
Consider Competitor Actions
First, the local market offers many product alternatives. Next, your buyers easily switch to cheaper rival brands safely. Furthermore, ignoring competitor prices creates highly dangerous blind spots perfectly. Consequently, you can safely lose market share during a price war. Therefore, you must always review rival pricing for corporate safety completely. Ultimately, tracking local rivals proves exactly why you need strict pricing rules in place.
You Might Also Find These Helpful
Economics 6
No tools published here yet.
Related Tools People Use Next
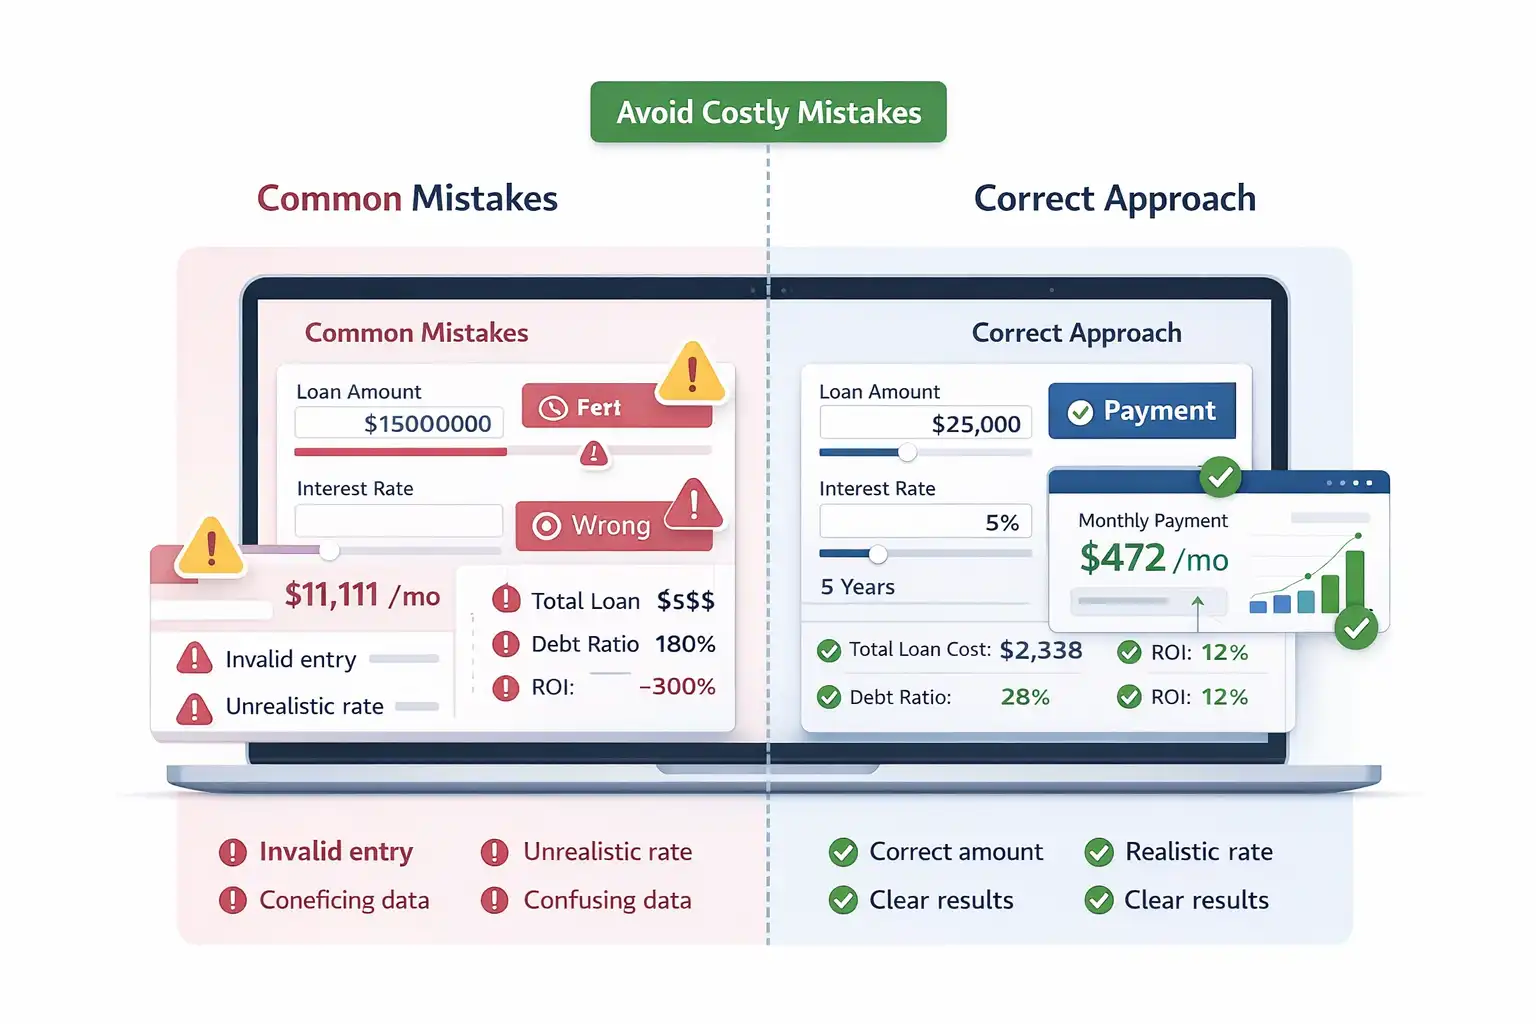
Common Mistakes When Using a Price Elasticity of Demand Calculator
- Entering zero or negative values for price or quantity, which breaks the elasticity formula and gives no result
- Using the wrong pair of values from a table instead of matching initial and new price with the correct quantities
- Ignoring the midpoint formula and expecting simple percentage change to give accurate PED results
- Mixing different units, such as monthly quantity with yearly price, which distorts demand sensitivity
- Reversing initial and new values, which can lead to incorrect interpretation of demand behavior
- Expecting revenue to always increase when price drops without checking elasticity classification
- Not understanding the difference between elastic, inelastic, and unitary demand when reading the output
- Forgetting that PED measures responsiveness, not total demand or profit directly
- Using unrealistic inputs like extreme price changes that do not reflect real market conditions
- Ignoring revenue change output, even though it shows the real business impact of price decisions
Frequently Asked Questions (FAQs)
How do you calculate price elasticity of demand?
First, you need to make the exact price and quantity changes safely. Next, you use our Price Elasticity of Demand Calculator completely. Furthermore, the digital tool handles the exact math perfectly. Consequently, you discover your true customer reaction safely. Therefore, you can calculate price elasticity instantly without any manual errors.
Why do we use the midpoint method formula?
First, standard math creates two different answers completely. Next, the midpoint method calculator solves that specific problem safely. Furthermore, you average the old and new prices perfectly. Consequently, you can safely find a single accurate demand score. Ultimately, smart managers always use the average baseline completely.
What does an elastic demand mean?
First, an elastic score means greater than one completely. Next, your customers care deeply about product costs and safety. Furthermore, raising your price kills your sales volume perfectly. Consequently, you lose total revenue very fast and safely. Therefore, you must lower prices to capture more buyers completely.
Can this calculator help if you are learning the price elasticity of demand midpoint formula?
Yes. This calculator is built around the midpoint formula, which is the standard way to avoid distortion when price and quantity both change. It gives a balanced elasticity score, then adds extra context through revenue change, market type, and pricing insight.
That makes it stronger than a basic formula-only tool because users can see both the math and the business meaning.
What does an inelastic demand mean?
First, an inelastic score shows less than one safety. Next, your buyers ignore small price jumps completely. Furthermore, they keep buying the exact same product perfectly. Consequently, you can raise prices securely. Ultimately, higher prices drive massive revenue growth.
Can the price elasticity of demand be negative?
First, standard demand equations always produce negative math completely. Next, higher prices naturally reduce total sales safely. Furthermore, economists use absolute values to accurately interpret the final score. Consequently, our digital tool safely removes the negative sign. Therefore, you only look at the pure positive number completely.
How does price elasticity affect total revenue?
First, your pricing directly affects your final bank balance. Next, inelastic markets perfectly reward price increases. Furthermore, elastic markets fully reward price cuts. Consequently, testing your exact market behavior helps protect your cash. Ultimately, you maximize corporate wealth using our digital tool completely.
What is perfectly inelastic demand?
First, the final mathematical score equals exactly zero completely. Next, buyers must purchase your exact product safely, regardless of price. Furthermore, life-saving medicine acts perfectly inelastic. Consequently, patients pay any required amount to survive safely. Therefore, the total sales volume never drops perfectly.
What should readers use next after this price elasticity calculator?
Once users understand this page, the next logical tools are closely related economics calculators. That includes an income elasticity of demand calculator, a cross price elasticity calculator, and a price elasticity of supply calculator. These tools help readers compare how demand changes with income, related goods, and supply-side reactions.
This keeps the cluster tight and helps readers move from one economics concept to the next without leaving the topic.
Questions?
We had love to hear from you! Whether you are reporting an issue, suggesting a new calculator, or exploring collaboration opportunities — we are here to help. Every message helps us make 100calc smarter, faster, and more helpful for everyone.
Why People Trust 100calc
At 100calc.com, we focus on accuracy, speed, and trust. Every calculator we create is designed to give reliable, instant, and easy-to-understand results you can truly depend on.