Cross Price Elasticity Calculator With Substitutes and Complements
A cross price elasticity calculator measures how demand for one product changes when the price of another product changes. It helps identify whether goods are substitutes, complements, or independent using percentage change and midpoint calculation.
Most people guess product relationships wrong. A price change in one product can quietly shift demand for another without obvious signals. That leads to poor pricing decisions, missed opportunities, and incorrect market assumptions.
This tool shows the exact relationship between products using real inputs. You will see elasticity value, demand response, and market classification in seconds. It also helps you understand substitutes, complements, and independent goods without manual calculations.
Quick Facts
- Positive elasticity means substitute products
- Negative elasticity means complementary goods
- Near zero means no strong relationship
- Based on midpoint percentage change method
- Updated Jun 16, 2026
- Reviewed by 100Calc Research Team
Cross Price Elasticity Calculator: Track Rivals
First, you can instantly predict your exact product relationship. Next, you must enter your specific market details completely. Consequently, the digital tool safely processes your exact pricing formula. Furthermore, you will discover your exact competitor correlation perfectly. Finally, the system generates your exact demand numbers directly on your screen safely.
Explore More Calculators
Calculate price elasticity of demand instantly using the midpoint formula. Get accurate PED score, revenue impact, and real examples in seconds.
Try calculatorFind your true cost per unit in seconds. This Average Variable Cost Calculator shows your pricing floor and warns when each sale starts losing…
Try calculatorUse the Comparative Advantage Calculator to compare opportunity costs, find who should specialize, and avoid the table mistakes that flip answers.
Try calculatorUse this High Low Method Calculator to find variable cost per unit, fixed cost, and projected total cost fast for budgeting, pricing, and planning.
Try calculatorUse this marginal cost function calculator to find cost per unit instantly. Enter change in cost and output to make smarter pricing decisions fast.
Try calculatorUse this marginal revenue calculator to find profit per unit fast. Compare cost, revenue, and output to make smarter pricing decisions instantly.
Try calculatorExplore Related Tools
How to Use a Cross Price Elasticity Calculator With Real Examples
Want to check how this calculator works before entering your own market data? Start with the examples below. Each one shows a real cross price elasticity calculation example, expected output, and a short explanation. That makes it easier to understand substitutes, complements, product relationships, and percentage change before testing your own numbers.
What happens when Product A gets more expensive and demand for Product B rises?
This is the classic substitutes case. When the price of Product A rises, buyers switch to Product B. That creates a positive cross price elasticity value.
Use these inputs in the calculator:
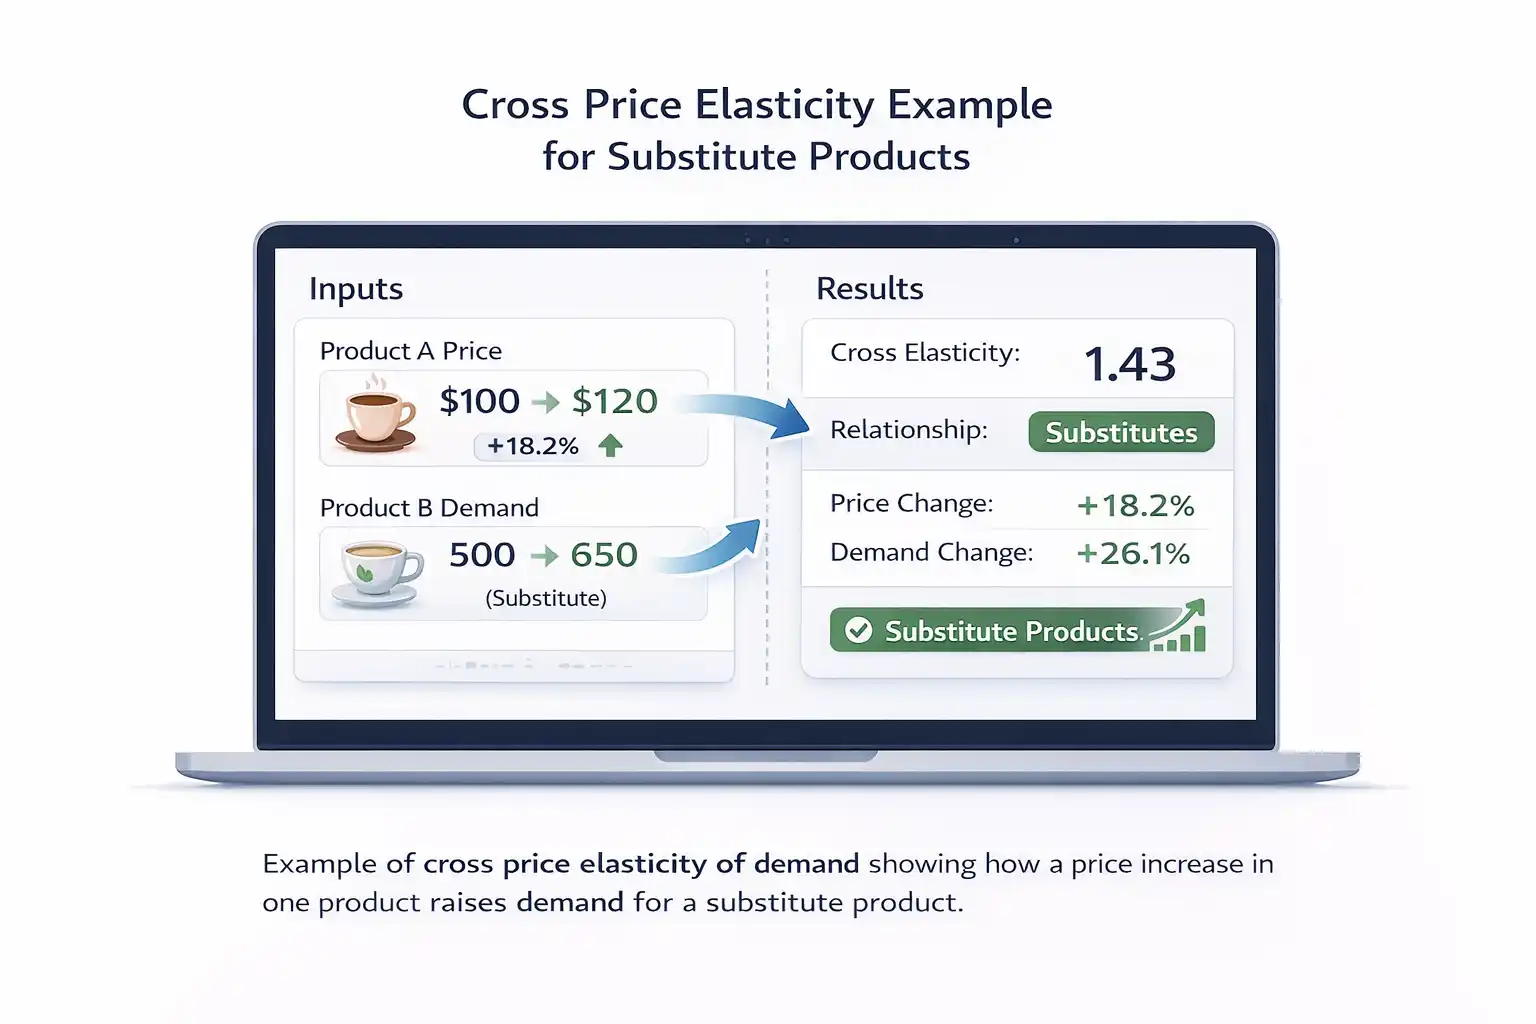
- Target Market: United States ($)
- Initial Price of Product A: 100
- Initial Demand of Product B: 500
- Final Price of Product A: 120
- Final Demand of Product B: 650
Expected output:
- Cross Elasticity: 1.43
- Relationship: SUBSTITUTES
- Price % Δ (A): 18.2%
- Demand % Δ (B): 26.1%
- Volume Diff: +150 Units
- Status: VERIFIED
Expected interpretation:
Product A and Product B are substitutes. A price increase in Product A pushes buyers toward Product B. That is why demand for B rises when A becomes less attractive.
What happens when Product A gets more expensive and demand for Product B falls?
This is a strong complements example. The goods are linked, so a higher price for Product A reduces the demand for Product B.
Use these inputs in the calculator:
- Target Market: Canada ($)
- Initial Price of Product A: 100
- Initial Demand of Product B: 500
- Final Price of Product A: 120
- Final Demand of Product B: 400
Expected output:
- Cross Elasticity: -1.22
- Relationship: COMPLEMENTS
- Price % Δ (A): 18.2%
- Demand % Δ (B): -22.2%
- Volume Diff: -100 Units
- Status: VERIFIED
Expected interpretation:
These products are complements. Buyers usually consume them together, so a price increase in Product A causes a drop in demand for Product B.
What happens when Product A changes price but demand for Product B barely moves?
This is an independent goods example. Price changes in Product A do not have a meaningful effect on Product B demand.
Use these inputs in the calculator:
- Target Market: United Kingdom (£)
Initial Price of Product A: 100
Initial Demand of Product B: 500
Final Price of Product A: 120
Final Demand of Product B: 502
Expected output:
- Cross Elasticity: 0.02
- Relationship: INDEPENDENT
- Price % Δ (A): 18.2%
- Demand % Δ (B): 0.4%
- Volume Diff: +2 Units
- Status: VERIFIED
Expected interpretation:
The relationship is independent. Product B demand barely changes even though Product A becomes more expensive. That suggests the two products do not compete or move together in a meaningful way.
What happens when Product A gets cheaper and demand for Product B rises sharply?
This is a useful complements example in reverse direction. A lower price for Product A increases the demand for Product B because buyers often use both goods together.
Use these inputs in the calculator:
- Target Market: India (₹)
- Initial Price of Product A: 200
- Initial Demand of Product B: 1000
- Final Price of Product A: 180
- Final Demand of Product B: 1250
Expected output:
- Cross Elasticity: -2.11
- Relationship: COMPLEMENTS
- Price % Δ (A): -10.5%
- Demand % Δ (B): 22.2%
- Volume Diff: +250 Units
- Status: VERIFIED
Expected interpretation:
Product A and Product B are complements. A lower price for A lifts sales of B because the products work together in the same buying decision.
What happens when Product A gets more expensive and Product B loses some demand?
This is another good cross price elasticity demand calculator test because it shows a weaker complements relationship.
Use these inputs in the calculator:
- Target Market: Pakistan (₨)
- Initial Price of Product A: 50
- Initial Demand of Product B: 800
- Final Price of Product A: 60
- Final Demand of Product B: 720
Expected output:
- Cross Elasticity: -0.58
- Relationship: COMPLEMENTS
- Price % Δ (A): 18.2%
- Demand % Δ (B): -10.5%
- Volume Diff: -80 Units
- Status: VERIFIED
Expected interpretation:
The products are still complements, but the link is weaker than the earlier example. Demand for Product B falls, yet the reaction is not as large.
How do these cross price elasticity examples help you understand product relationships?
Each example shows how price changes in one product can shift demand for another. That helps readers understand substitutes, complements, and independent goods without solving the cross price elasticity equation by hand. It also makes the calculator more useful for pricing strategy, competitor analysis, and product positioning.
How Should You Read Cross Price Elasticity Results for Substitutes, Complements, and Independent Goods?
Cross price elasticity shows how demand for one product reacts when another product’s price changes. A positive value signals substitutes. A negative value signals complements. Values near zero suggest no strong relationship. Use this table to quickly interpret your calculator results and take the right pricing or market decision.
| Elasticity Value | Relationship Type | Market Meaning | Business Action | Smart Note |
|---|---|---|---|---|
| Positive (Above 0.05) | Substitutes | Products compete with each other | Track competitor pricing closely | If Product A price rises, Product B demand increases |
| Negative (Below -0.05) | Complements | Products are used together | Bundle or cross-sell both products | If Product A price rises, Product B demand falls |
| Near Zero (-0.05 to 0.05) | Independent | No strong market relationship | Price changes have little cross-impact | Products do not influence each other's demand |
Smart note: If your cross elasticity value is close to zero, avoid over-interpreting the relationship. Small changes can be caused by noise or limited data rather than real market behavior.
How to Use the Cross Price Elasticity
This cross price elasticity calculator uses real input values to measure how demand for one product reacts when another product’s price changes. It applies the midpoint formula and shows the relationship as substitutes, complements, or independent goods in seconds.
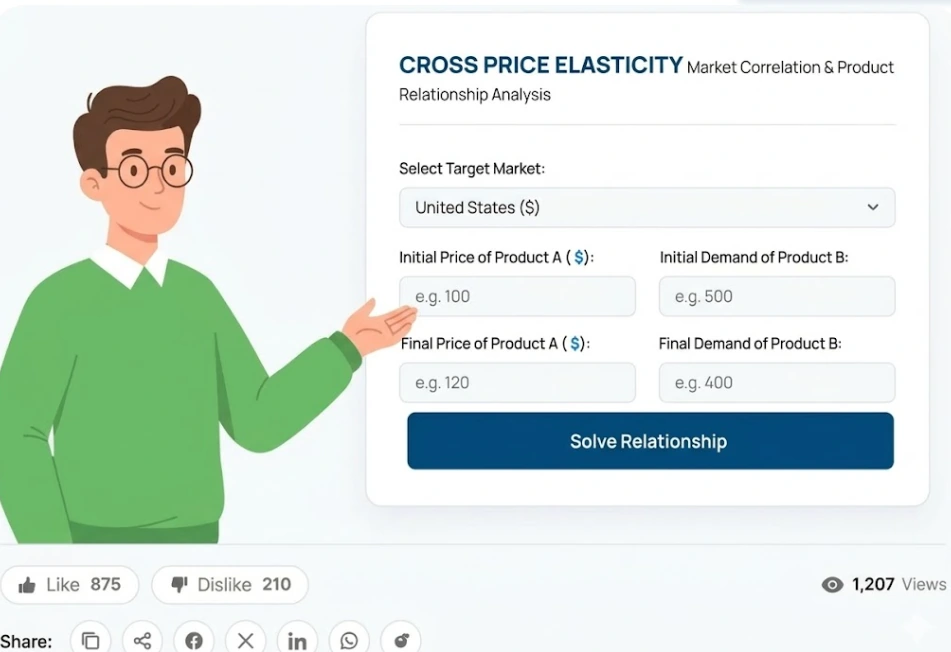
Select your target market
Start by choosing a country from the dropdown. This updates the currency and aligns your results with a real market context. It helps you analyze product relationships based on localized pricing behavior and demand patterns.
Enter Product A price values
Add the initial price and the new price for Product A. These values define the percentage price change. A higher or lower price shift will directly affect how demand for Product B responds.
Enter Product B demand values
Input the starting demand and the updated demand for Product B. These numbers show how buyers reacted after the price change. Accurate demand data leads to more reliable cross price elasticity results.
Calculate cross price elasticity
Click the calculate button to apply the midpoint formula. The tool computes percentage change in price and demand. It then divides demand change by price change to produce the elasticity coefficient.
Review market relationship and insights
Results appear instantly with elasticity value, demand shift, and product relationship. A positive value signals substitutes. A negative value shows complements. Values near zero indicate independent goods with weak market connection.
Example for testing
First, try these sample numbers to see exactly how the digital tool works completely. Next, you can verify the financial result instantly and safely.
Target Market: United States ($)
Initial Price of Product A: $10
Final Price of Product A: $12
Initial Demand ofProduct B: 500 Units
Final Demand ofProduct B: 600 Units
Result → First, you calculate the exact price change completely. Your competitor raised their price safely. Next, you calculate your exact unit change safely. Consequently, your sales volume grew by exactly 100 units. Furthermore, the system securely processes the midpoint formula. Your exact demand score equals exactly 1.0. Then the tool securely classifies your exact market. Your exact relationship type shows strict substitutes completely.
Finally, enter your own business numbers safely.
How the Cross Elasticity of Demand Formula Explained (Complete Breakdown)
Understanding the cross price elasticity of demand formula helps you see how two products are connected. This formula measures how demand for Product B changes when the price of Product A changes. It uses percentage change and midpoint logic to give a balanced and accurate elasticity value.
Cross Price Elasticity Formula
Eₓy = [(Q₂ - Q₁) / ((Q₁ + Q₂) / 2)] ÷ [(P₂ - P₁) / ((P₁ + P₂) / 2)]
What Each Variable Means
Each part of the formula represents a real market change. These inputs match exactly with your calculator fields.
P₁ (Initial Price of Product A)
Represents the starting price before any change happens. This value sets the baseline for measuring price movement.
P₂ (Final Price of Product A)
Shows the updated price after the change. From here, you can see if the price moved up or down.
Q₁ (Initial Demand of Product B)
Captures how many units were sold before the price shift in Product A. It reflects the original demand level.
Q₂ (Final Demand of Product B)
Indicates how demand changed after the price adjustment. This number reveals how buyers reacted in the market.
Why the Midpoint Formula Is Used
Simple percentage change can give different results depending on direction. That creates confusion when analyzing substitutes or complements.
The midpoint method fixes this problem. It uses the average of values instead of just starting numbers. This makes the cross price elasticity calculator more accurate and consistent.
That is why this method is used in economics, pricing strategy, and demand analysis.
Why the Midpoint Formula Is Used
Numbers alone do not tell the full story. This formula shows how pricing changes affect demand, which leads to smarter decisions.
- Identify substitute products in your market
- Find complementary goods that sell together
- Understand demand shifts caused by price changes
- Improve pricing strategy based on real behavior
- Analyze competitors using cross price elasticity
When Should You Use This Cross Price Elasticity Calculator
You will get the most accurate results when these inputs are available:
- Two price points for Product A
- Matching demand data for Product B
- Real market data or test scenarios
- Pricing experiments or competitor changes
It is useful for business owners, analysts, students, and marketers who want fast and reliable insights.
Another Example Calculation (Step-by-Step)
Step-by-Step Cross Price Elasticity Calculation Example
Let’s walk through a real example using the same logic as the calculator.
Given:
- Initial Price of Product A = 80
- Final Price of Product A = 100
- Initial Demand of Product B = 400
- Final Demand of Product B = 520
Calculation:
					Step 1: Calculate Price Change

Price midpoint = (80 + 100) ÷ 2 = 90
Price change = (100 - 80) ÷ 90 = 0.222

Step 2: Calculate Demand Change

Demand midpoint = (400 + 520) ÷ 2 = 460
Demand change = (520 - 400) ÷ 460 = 0.261

Step 3: Calculate Cross Elasticity

Eₓy = 0.261 ÷ 0.222 = 1.18
Result:
- Cross Elasticity = 1.18
- Relationship = Substitutes
Meaning:
A positive elasticity value shows that the products compete. When Product A becomes more expensive, demand shifts toward Product B. This is common in markets with similar alternatives.
Standard Product Relationship Benchmarks
| Market Category | Exact CPED Score | Revenue Risk | Category Meaning |
|---|---|---|---|
| Strong Substitutes | Greater Than +0.05 | High Risk | Buyers switch brands instantly completely. Competitor price drops steal your sales safely. |
| Independent Goods | Between -0.05 and +0.05 | Zero Risk | Buyers ignore the other product safely. External prices change absolutely nothing perfectly. |
| Weak Complements | Between -0.05 and -0.50 | Low Risk | Buyers sometimes purchase both items safely. You can bundle them for small gains completely. |
| Strong Complements | Less Than -0.50 | High Reward | Buyers always purchase both items perfectly. Partner price drops explode your sales safely. |
Note: Next, you must remember your specific final revenue relies entirely on your exact calculated numbers safely.
Tips for Managing Competitor Pricing
You must carefully and thoroughly plan your market strategy. The smart managers protect their total market sales safely. And, you avoid making dangerous pricing choices perfectly. Furthermore, you can use our Cross Price Elasticity Calculator to test new market relationships securely. Ultimately, applying these expert tips guarantees a much safer corporate future.

Monitor Rival Price Cuts
Bundle Complementary Items
Ignore Independent Goods
You Might Also Find These Helpful
Economics 6
No tools published here yet.
Related Tools People Use Next
Common Mistakes When Using a Cross Price Elasticity Calculator
- Mixing Product A price with Product B demand
- Entering wrong price or demand values
- Ignoring percentage change direction
- Misreading positive vs negative results
- Using raw values instead of midpoint method
- Treating weak values as strong relationships
- Skipping real market context while analyzing
- Relying on one calculation without comparison
Frequently Asked Questions (FAQs)
How do you calculate cross-price elasticity?
Cross price elasticity of demand is calculated by dividing the percentage change in demand for one product by the percentage change in price of another product. The midpoint formula is used to improve accuracy. This method helps identify substitutes, complements, and independent goods.
Small changes in price or demand can affect the result. Using average values reduces distortion and gives more reliable market insights.
What is cross elasticity in simple words?
Cross elasticity shows how demand for one product reacts when another product’s price changes. A positive value means products compete. A negative value means they are used together. A value near zero suggests no strong relationship between them.
This concept helps businesses understand how products interact in real markets. It is widely used in pricing and demand analysis.
Which formula is used for cross price elasticity?
The cross price elasticity formula uses percentage change in demand divided by percentage change in price. Most calculators use the midpoint method to balance both values. This avoids misleading results when price or demand changes are large.
Using this formula helps measure demand sensitivity between related products. It also improves decision making in competitive markets.
Can this calculator help with percentage change and midpoint logic?
Yes. This tool uses midpoint-style percentage change for both price and demand. That is important because midpoint logic gives a more balanced result when two values change. It also makes the cross price elasticity formula calculator more reliable than a rough percentage-only estimate.
What does a cross-price elasticity of 0.5 mean?
A cross price elasticity of 0.5 shows a weak positive relationship between two products. Demand for one product increases when the other product’s price rises, but the effect is not strong. This usually indicates weak substitutes.
Such results suggest partial competition. Businesses can adjust pricing, but the impact may remain moderate.
How to interpret a negative cross elasticity value?
A negative cross elasticity value means the products are complements. Demand for one product decreases when the price of another product increases. This relationship is common in paired goods like fuel and cars or printers and ink.
Understanding this helps in bundling strategies and joint pricing decisions. It also reveals dependency between products.
How do substitute goods affect cross elasticity results?
Substitute goods produce a positive cross elasticity value. When the price of one product rises, demand shifts toward the alternative. This behavior shows direct competition between products in the same category.
Stronger positive values indicate closer substitutes. Businesses can use this to track competitors and adjust pricing strategies.
Can cross price elasticity be zero in real markets?
Cross price elasticity can be zero when two products are unrelated. A price change in one product does not affect demand for the other. This situation reflects independent goods with no market link.
In real markets, values close to zero are more common than exact zero. Minor changes often occur due to noise or external factors.
What should readers explore after using this cross price elasticity calculator?
Once users understand cross elasticity, the next step is to compare it with related economics tools. That includes a price elasticity of demand calculator, an income elasticity of demand calculator, and a price elasticity of supply calculator. Together, these calculators explain how demand shifts across price, income, and market competition.
Questions?
We had love to hear from you! Whether you are reporting an issue, suggesting a new calculator, or exploring collaboration opportunities — we are here to help. Every message helps us make 100calc smarter, faster, and more helpful for everyone.
Why People Trust 100calc
At 100calc.com, we focus on accuracy, speed, and trust. Every calculator we create is designed to give reliable, instant, and easy-to-understand results you can truly depend on.