Marginal Revenue Calculator to Find Profit Per Unit and Output Level
A marginal revenue calculator shows how much extra revenue you earn from selling one more unit. It divides the change in total revenue by the change in quantity. This helps you find the optimal production level and compare marginal revenue with cost.
Most businesses grow sales but lose profit without noticing. Revenue goes up, yet margins shrink. That hidden gap between revenue and cost decides whether scaling helps or hurts. Many calculations miss this detail and lead to poor pricing decisions.
This tool reveals real profit per unit using your actual numbers. You will see marginal revenue, total change, and margin instantly. It also helps compare revenue with cost so you can decide when to expand, adjust pricing, or stop production.
Quick Facts
- Marginal Revenue = Change in Revenue ÷ Change in Quantity
- Helps find profit-maximizing output level
- Works with real revenue and quantity data
- Compares directly with variable cost
- Used in pricing, economics, and business strategy
- Updated Jun 16, 2026
- Reviewed by 100Calc Research Team
Marginal Revenue Calculator: Maximize Profits
You can use the digital tool easily. First, you must provide your specific production numbers. Next, the digital tool processes your provided data instantly. Furthermore, you will receive a detailed financial breakdown in a safe manner. The system generates accurate scaling plans right on your screen.
MARGINAL REVENUE
TOTAL CHANGE
--
Explore More Calculators
Calculate price elasticity of demand instantly using the midpoint formula. Get accurate PED score, revenue impact, and real examples in seconds.
Try calculatorFind your true cost per unit in seconds. This Average Variable Cost Calculator shows your pricing floor and warns when each sale starts losing…
Try calculatorUse the Comparative Advantage Calculator to compare opportunity costs, find who should specialize, and avoid the table mistakes that flip answers.
Try calculatorUse this cross price elasticity calculator to see if products are substitutes or complements. Get instant results, % changes, and clear market insights in…
Try calculatorUse this High Low Method Calculator to find variable cost per unit, fixed cost, and projected total cost fast for budgeting, pricing, and planning.
Try calculatorUse this marginal cost function calculator to find cost per unit instantly. Enter change in cost and output to make smarter pricing decisions fast.
Try calculatorExplore Related Tools
How to Calculate Marginal Revenue With Real Examples
Not sure what numbers to enter first? Start with these real scenarios. Each example shows how marginal revenue changes with quantity, price, and cost. That makes it easier to understand revenue growth, marginal profit, and production decisions before using your own data.
How does marginal revenue change when sales increase steadily?
A small increase in sales often leads to steady revenue growth. This example shows how marginal revenue per unit behaves when output rises without major pricing pressure.
Use these inputs in the calculator:
- Initial Revenue: 4,000
- New Revenue: 4,800
- Initial Quantity: 80
- New Quantity: 100
- Avg Variable Cost: 20
Calculation:
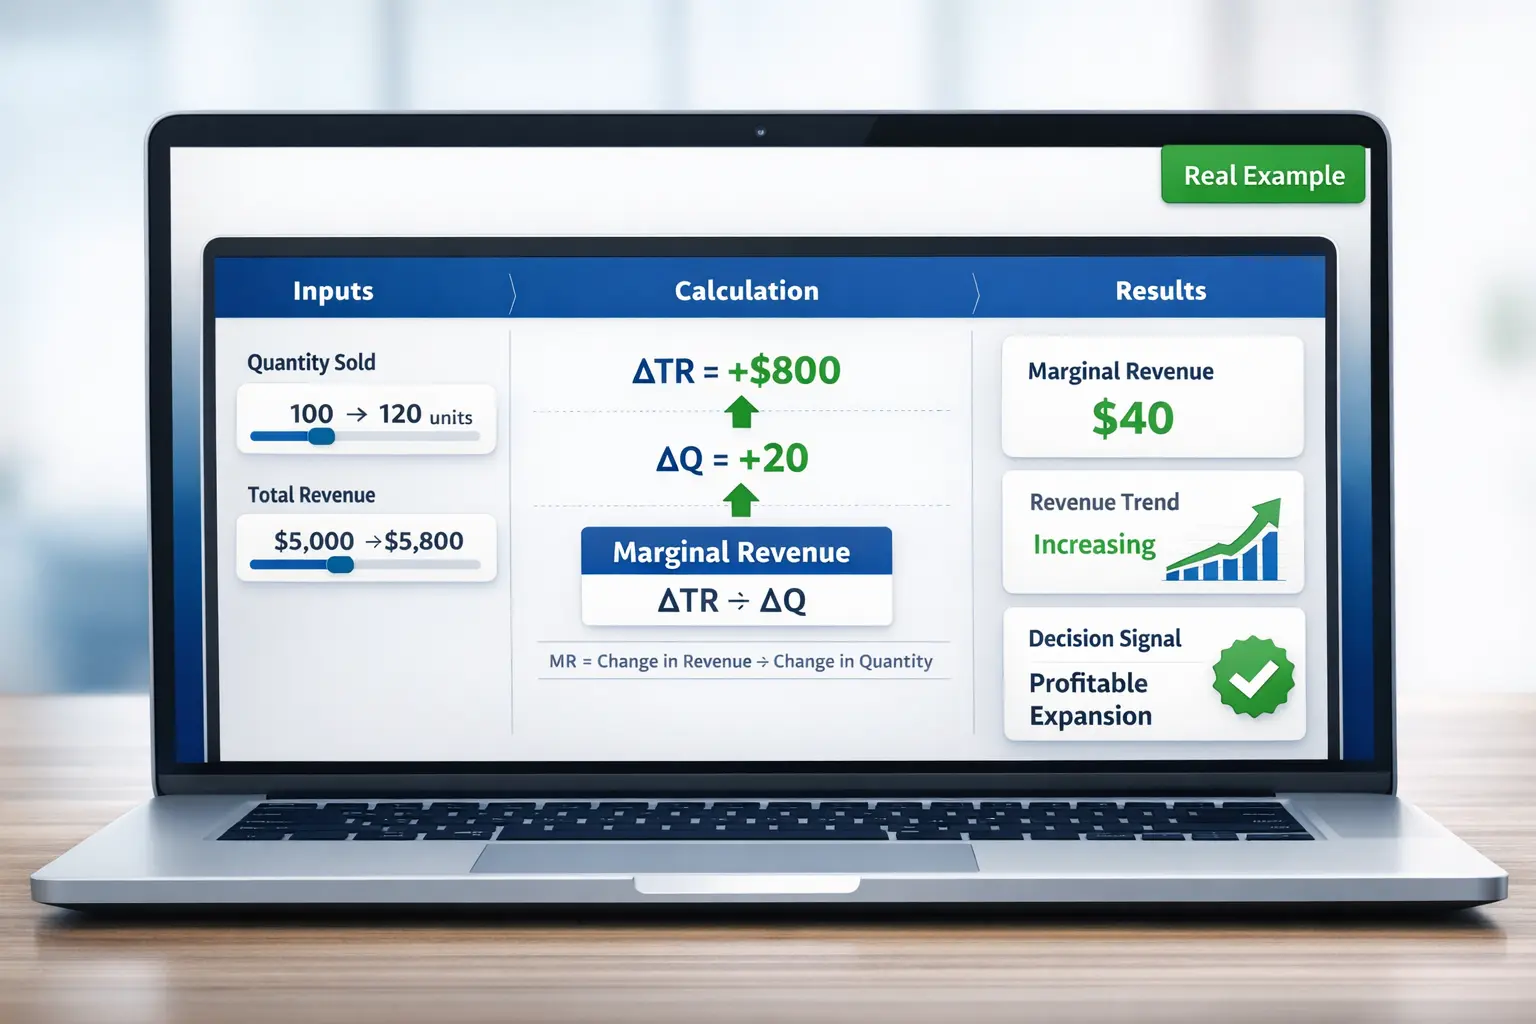
- Change in Revenue = 800
- Change in Quantity = 20
- Marginal Revenue = 800 ÷ 20 = 40
Result:
- Marginal Revenue = $40 per unit
- Net Margin = 40 – 20 = $20 profit per unit
Meaning:
Each extra unit adds strong revenue above cost. This signals healthy growth and supports scaling production.
How to calculate marginal revenue from a table example
Sometimes data comes in table form. This scenario mirrors that setup and helps translate total revenue changes into marginal revenue.
Use these inputs in the calculator:
- Initial Revenue: 7,500
- New Revenue: 8,100
- Initial Quantity: 150
- New Quantity: 165
- Avg Variable Cost: 30
Calculation:
- Revenue Change = 600
- Quantity Change = 15
- Marginal Revenue = 600 ÷ 15 = 40
Result:
- Marginal Revenue = $40
- Net Margin = 40 – 30 = $10
Meaning:
Revenue still increases, but margin shrinks. This suggests rising production costs or pricing pressure.
What happens when marginal revenue drops below cost?
Growth does not always mean profit. This case shows when selling more units becomes inefficient.
Use these inputs in the calculator:
- Initial Revenue: 9,000
- New Revenue: 9,400
- Initial Quantity: 200
- New Quantity: 220
- Avg Variable Cost: 25
Calculation:
- Revenue Change = 400
- Quantity Change = 20
- Marginal Revenue = 400 ÷ 20 = 20
Result:
- Marginal Revenue = $20
- Net Margin = 20 – 25 = -5 loss per unit
Meaning:
Each additional unit reduces profit. Production beyond this point may not be optimal.
Marginal revenue calculator with cost optimization example
This example highlights how marginal revenue connects with marginal profit and business decisions.
Use these inputs in the calculator:
- Initial Revenue: 6,200
- New Revenue: 7,100
- Initial Quantity: 120
- New Quantity: 140
- Avg Variable Cost: 35
Calculation:
- Revenue Change = 900
- Quantity Change = 20
- Marginal Revenue = 900 ÷ 20 = 45
Result:
- Marginal Revenue = $45
- Net Margin = 45 – 35 = $10
Meaning:
Production is still profitable. However, margin is narrowing, so further expansion should be tested carefully.
How marginal revenue behaves in high-volume scaling
Large output shifts can change revenue efficiency. This example shows how scaling affects marginal revenue.
Use these inputs in the calculator:
- Initial Revenue: 15,000
- New Revenue: 16,200
- Initial Quantity: 300
- New Quantity: 360
- Avg Variable Cost: 28
Calculation:
- Revenue Change = 1,200
- Quantity Change = 60
- Marginal Revenue = 1,200 ÷ 60 = 20
Result:
- Marginal Revenue = $20
- Net Margin = 20 – 28 = -8
Meaning:
High volume reduces revenue per unit. This often happens in competitive markets or discount pricing strategies.
How Should You Interpret Marginal Revenue Results for Better Profit Decisions?
Marginal revenue shows how much extra income each unit adds. It becomes powerful when compared with cost and output levels. A higher value signals growth potential. A lower value warns of inefficiency. Use this table to turn your marginal revenue calculator result into a clear action.
| Method | Best for | Accuracy level | Smart Note |
|---|---|---|---|
| MR > MC | Scaling output and increasing production | High | Each extra unit adds profit. Expanding output is usually the right move. |
| MR = MC | Finding the profit-maximizing point | Balanced | This is the optimal level. Producing more or less may reduce total profit. |
| MR < MC | Reducing losses and controlling costs | Critical | Each new unit reduces profit. Lower output or adjust pricing strategy. |
| MR Declining Fast | Competitive or saturated markets | Moderate | Falling MR signals demand pressure. Review pricing, demand curve, and positioning. |
Smart note: If marginal revenue shifts quickly across small output changes, test multiple scenarios. Demand curve shape, pricing strategy, and marginal cost structure can all impact your result.
Understanding Your Production Growth Results
The marginal revenue calculator provides a comprehensive corporate financial analysis. Therefore, you must carefully understand the specific performance measurements. Ultimately, the output accurately reflects your production capacity. You can clearly visualize your final manufacturing plan.
Analyzing Your Incremental Income
First, the system calculates the safe specific limit for your product pricing. The final number perfectly reveals your true sales capacity. Consequently, you know exactly when you must stop dropping prices. Furthermore, we provide a clear income metric to fully protect your cash flow.
Tracking Your Variable Costs
Next, the digital tool compares your new income with your variable expenses. Smart founders actively use those specific dollars to plan factory expansions first. Furthermore, we instantly calculate your real profit. Consequently, you understand your entire corporate manufacturing journey. Thus, you can scale your operations safely.

Result Breakdown:
- Marginal Revenue: First, we display the exact amount generated by selling one extra item. The specific number perfectly reveals your true scaling power.
- Total Change: Next, the digital tool shows exactly how much your total sales have increased safely. Business leaders actively use that specific rating to fully measure their volume success.
- Net Margin: Finally, we calculate your exact profit per additional unit. Consequently, you understand the exact financial gain available for new production perfectly.
How to Use the Marginal Revenue Calculator
This marginal revenue calculator uses real revenue and output values to measure how much extra income each additional unit generates. It applies the marginal revenue formula using change in total revenue and quantity. Results appear instantly, so you can evaluate profit potential and production decisions without manual calculation.
Enter your initial and final revenue
Start by adding your total revenue before and after a change in sales. These values show how your business income shifts when output increases. Accurate revenue data improves marginal revenue results and helps reflect real pricing and market behavior.
Add quantity sold values
Next, input how many units you sold before and after the change. This defines the output difference used in the marginal revenue formula. Even small quantity changes can reveal whether your growth strategy increases or reduces revenue efficiency.
Apply the marginal revenue formula
Click the calculate button to process your inputs. The tool finds the change in total revenue and divides it by the change in quantity. This produces marginal revenue, which shows the extra revenue earned per additional unit sold.
Review marginal revenue results
The calculator displays your marginal revenue value along with revenue trend indicators. Positive results suggest increasing returns per unit. Lower or declining values may signal pricing pressure or reduced demand strength in your market.
Compare revenue with cost for decisions
Use the result to compare marginal revenue with marginal cost. Profit improves when revenue exceeds cost. Production should slow or stop when costs rise above revenue. This step helps guide pricing strategy, output levels, and business growth decisions.
Example for testing
Try these sample numbers to see how the digital tool works. First, you can verify the financial result instantly:
Target Market: United States Dollars.
Initial Revenue: 5000 Dollars.
New Total Revenue: 5500 Dollars.
Initial Quantity Sold: 100 Items.
New Quantity Sold: 110 Items.
Average Variable Cost: 35 Dollars.
Result → The digital tool shows exactly 50 dollars for your marginal revenue safely. Furthermore, the math perfectly measures your 15-dollar net margin completely.
Now, enter your own business numbers and check your exact corporate requirements.
How the Incremental Revenue Formula Works (Complete Breakdown)
Understanding the marginal revenue formula helps you see how much extra income each additional unit generates. This calculation compares the change in total revenue with the change in quantity sold. It gives a clear signal for pricing, output decisions, and profit optimization.
Marginal Revenue Formula
Paste this directly into Elementor Code Highlighter (Markup mode):
MR = (TR2 - TR1) ÷ (Q2 - Q1)
This formula calculates how much additional revenue is earned for each extra unit sold.
Variable Definitions
Each variable matches the fields used in your marginal revenue calculator. That makes the transition from input to result simple and accurate.
TR₁ (Initial Total Revenue)
Represents total revenue before any change in output. This value sets the starting point for measuring revenue growth.
TR₂ (Final Total Revenue)
Shows total revenue after selling more units. This helps identify how much income increased after the output change.
Q₁ (Initial Quantity Sold)
Captures the number of units sold before the change. This value reflects your original production or sales level.
Q₂ (Final Quantity Sold)
Indicates how many units were sold after expansion. This number shows how output growth impacts revenue.
Why This Formula Matters for Business Decisions
Numbers alone do not guide strategy. This formula shows how each additional unit affects revenue, which helps you make smarter decisions.’
- Identify profitable output levels
- Detect declining revenue per unit
- Improve pricing strategy
- Analyze demand behavior
- Support profit maximization
When Should You Use a Marginal Revenue Calculator?
Accurate results depend on clean data. This tool works best when:
- two revenue points are available
- matching quantity values are recorded
- data reflects real sales or test scenarios
- pricing changes are consistent across the period
Business owners, analysts, and students use this method to evaluate growth and efficiency quickly.
Step-by-Step Marginal Revenue Calculation Example
Let’s walk through a fresh example using the same logic as your calculator.
Given:
- Initial Quantity Sold = 150
- Final Quantity Sold = 180
- Initial Total Revenue = $6,000
- Final Total Revenue = $6,900
Calculation:
					Step 1. Calculate Change in Revenue

Revenue change = 6,900 − 6,000 = 900

Step 2. Calculate Change in Quantity

Quantity change = 180 − 150 = 30

Step 3. Calculate Marginal Revenue

MR = 900 ÷ 30 = 30
Result:
- Marginal Revenue = $30 per unit
What This Means for Your Business
Each additional unit generates $30 in revenue. This indicates strong revenue growth at the current output level. If marginal cost stays below this value, expanding production can increase profit. If costs rise above it, scaling may reduce profitability.
Understanding Production Growth Benchmarks
The marginal revenue calculator helps you discover the true health of your pricing strategy perfectly. Therefore, you can easily understand your specific production boundaries completely. The table below clearly explains how different incremental revenue results affect your business health. Furthermore, the chart reveals your exact scaling power safely.
| Revenue vs Cost | Corporate Status | Financial Quality | Market Meaning |
|---|---|---|---|
| Revenue Greater Than Cost | Profitable | Strong | Expand Production |
| Revenue Equals Cost | Maximum Profit | Optimal | Hold Production |
| Revenue Less Than Cost | Taking Loss | Weak | Reduce Production |
| Revenue Drops Below Zero | Crisis Limit | Severe | Stop Production |
Note: First, you must always remember that producing items at a financial loss destroys your cash flow completely.
Interpretation
First, a clear wealth projection helps you plan your investments perfectly. For example, knowing the exact final cash changes your mindset from unsure to highly confident. Consequently, the marginal revenue calculator strictly requires accurate measurements for safe quotes. Generally, a high efficiency amount yields massive financial savings locally. Lower retained cash totals require significantly longer scaling periods in total.
Pro Tip:
- Verify Local Expenses: Always check your local operational bills before expanding. Exact market verification completely prevents inflated spending assumptions.
- Negotiate Monthly Costs: You must strictly lower your recurring expenses to boost your retained cash. Understanding specific pricing rules prevents unexpected capital losses.
- Track Profit Changes: Finally, monitor your specific category spending every single quarter. Consequently, you must remember that material prices fluctuate frequently.
Tips for Managing Your Production Expansion
Knowing your exact digital revenue limits helps you handle stressful market changes smoothly. Therefore, you should follow basic corporate rules safely. Consequently, you will prevent major financial failures perfectly. You can use your new data from the marginal revenue calculator to manage your business safely.
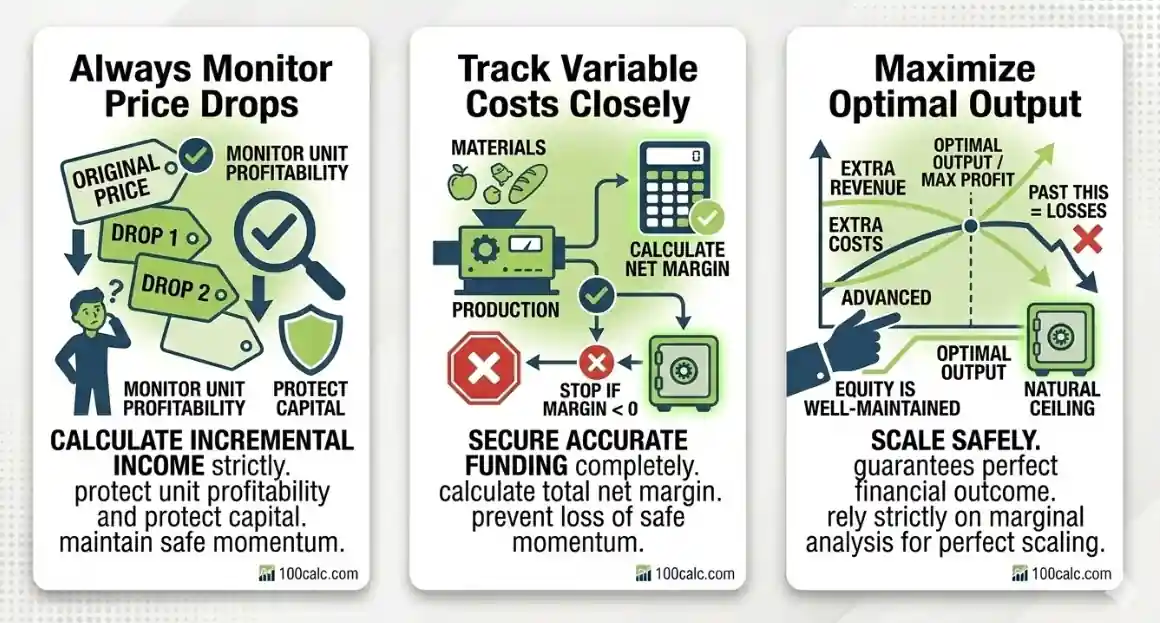
Always Monitor Price Drops
Track Variable Costs Closely
Maximize Optimal Output
You Might Also Find These Helpful
Economics 6
No tools published here yet.
Related Tools People Use Next
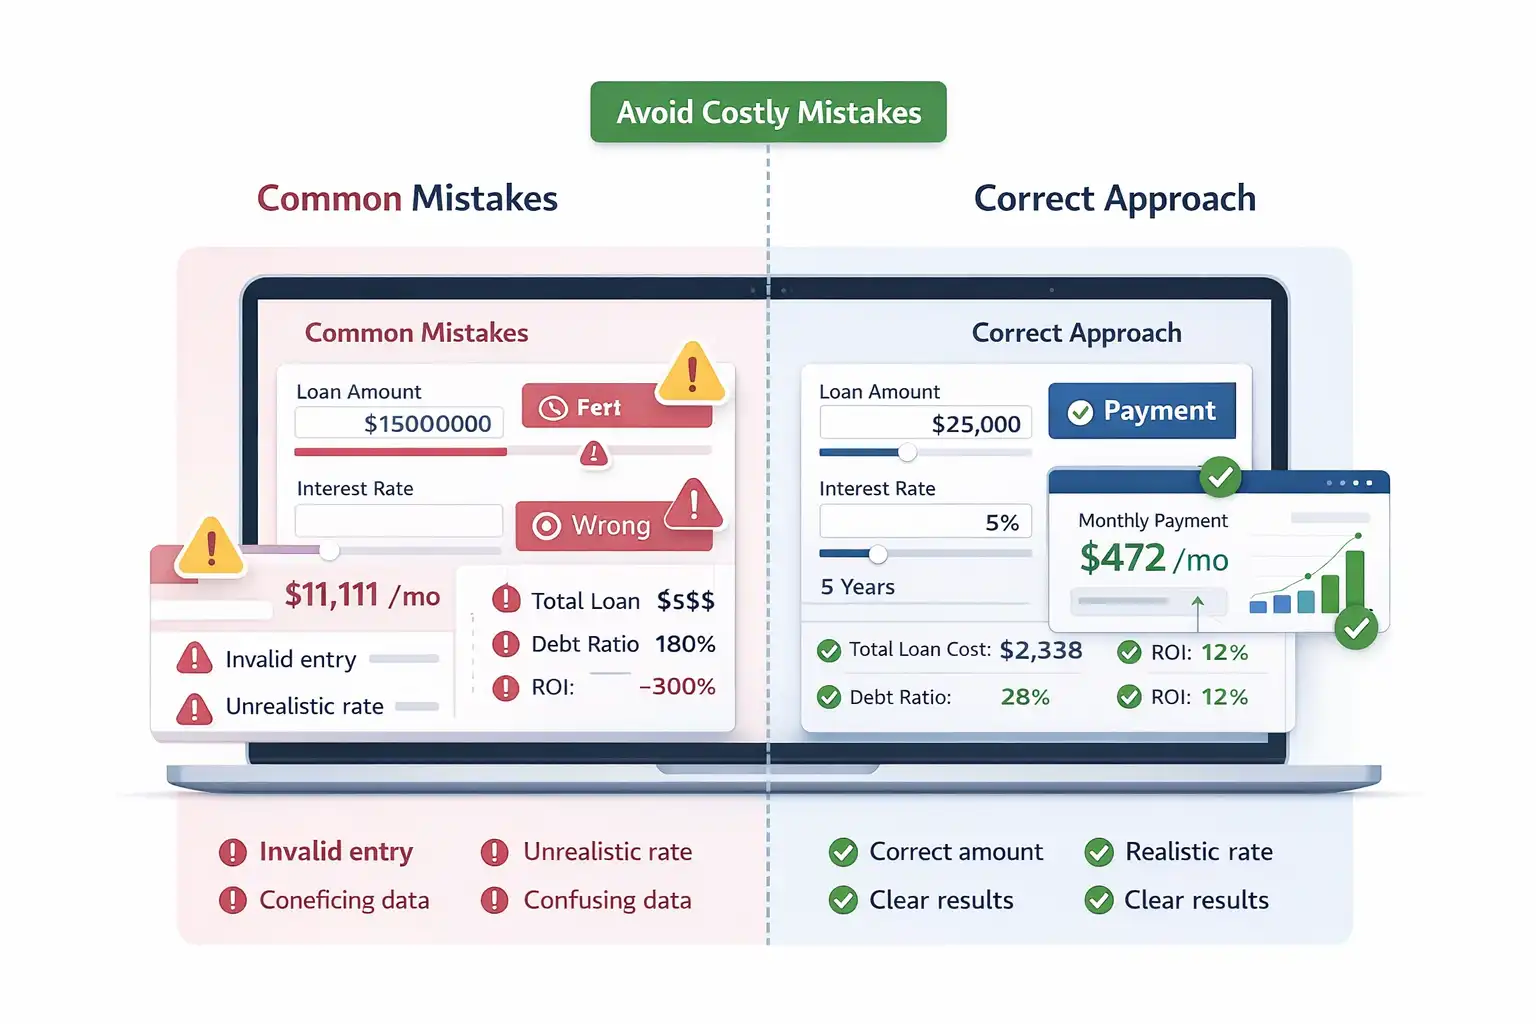
Common Mistakes When Using a Marginal Revenue Calculator
- Common Mistakes When Using a Marginal Revenue Calculator
- Entering total revenue values that are not consistent with the same pricing period
- Mixing units, such as daily sales with monthly revenue data
- Using estimated numbers instead of actual sales data
- Ignoring the change in quantity and focusing only on revenue
- Forgetting to compare marginal revenue with marginal cost
- Assuming higher revenue always means higher profit
- Not checking if demand conditions changed during the period
Frequently Asked Questions (FAQs)
How do you calculate marginal revenue?
Marginal revenue is calculated by dividing the change in total revenue by the change in quantity sold. This shows how much extra revenue you earn from one additional unit. It helps identify profitable output levels and supports pricing decisions in competitive or monopoly markets.
Small changes in output can shift revenue quickly. Tracking this value helps you avoid scaling at a loss.
How do you calculate total revenue and marginal revenue?
Total revenue equals price multiplied by quantity sold. Marginal revenue comes from the change between two revenue levels divided by the change in output. Together, they show both overall earnings and how each additional unit impacts growth and profitability. Using both metrics helps compare expansion versus efficiency.
What is the exact marginal revenue formula?
The marginal revenue formula is:
MR = ΔTR ÷ ΔQ
It measures the change in total revenue over the change in quantity. This formula works in business, economics, and calculus. It is used to evaluate revenue growth, demand behavior, and optimal production decisions. In calculus, marginal revenue is also the derivative of total revenue.
How do you calculate marginal cost and compare it with revenue?
Marginal cost is found by dividing the change in total cost by the change in quantity. When marginal revenue equals marginal cost, profit reaches its highest point. This comparison helps decide when to increase production or stop to avoid losses. Ignoring cost can lead to false profit signals.
Why does marginal revenue decrease as output increases?
Marginal revenue often drops due to price reductions needed to sell more units. In many markets, demand curves slope downward. Selling more requires lowering price, which reduces the revenue gained per additional unit over time. This effect is stronger in competitive and saturated markets.
When should you stop producing more units?
Production should stop when marginal revenue equals marginal cost. At this point, profit is maximized. Producing beyond this level increases cost faster than revenue, which reduces total profit and leads to inefficiency. Smart businesses monitor this balance closely
How do variable costs affect your business profit?
Variable costs increase with production. As output grows, these costs can reduce profit if marginal revenue does not keep up. Tracking both values helps maintain a healthy margin and prevents overproduction.
Even strong revenue growth can hide rising costs.
What is marginal revenue in simple terms?
Marginal revenue is the extra money earned from selling one more unit. It shows how each additional sale impacts total income. Businesses use it to decide pricing, output levels, and profit strategy. Simple numbers can reveal powerful insights.
How do you calculate marginal revenue from a table?
Marginal revenue from a table is calculated by finding the difference in total revenue between two rows and dividing it by the change in quantity. This method works well for discrete data and helps visualize revenue trends across output levels. Tables make it easier to spot profit turning points.
What is the marginal revenue product (MRP) formula?
Marginal revenue product equals marginal product multiplied by marginal revenue. It measures how much revenue an additional unit of input, such as labor, generates. This helps businesses decide hiring levels and resource allocation.
MRP connects production with revenue outcomes.
Questions?
We had love to hear from you! Whether you are reporting an issue, suggesting a new calculator, or exploring collaboration opportunities — we are here to help. Every message helps us make 100calc smarter, faster, and more helpful for everyone.
Why People Trust 100calc
At 100calc.com, we focus on accuracy, speed, and trust. Every calculator we create is designed to give reliable, instant, and easy-to-understand results you can truly depend on.