Expected Capital Gains Yield Calculator: Isolate True Price Growth
Expected capital gains yield measures the projected percentage increase in an asset price over time. This calculation completely excludes dividend payouts. Relying on total return metrics often hides decaying stock prices. Our calculator separates your true price appreciation from dividend income. You can forecast price changes or extract yields instantly.
Stop letting high dividends mask a shrinking portfolio. Many investors falsely believe massive cash payouts guarantee a profitable asset. This dangerous assumption creates severe value traps. You might be losing principal value without realizing it.
Use this tool to find your exact implied growth rate. The system projects future asset values over one, three, and five years. Discover if your underlying investment is actually growing today.
Quick Facts
- Best for: Equity investors, financial analysts, and portfolio managers.
- Key output: Capital gains yield, total expected return, and projected prices.
- Supported Models: Price Projection, Yield Extraction, and Gordon Growth.
- Tax Advantage: Separates taxable dividend income from deferred price growth.
- Updated Jun 16, 2026
- Reviewed by 100Calc Research Team
Valuation & Growth Engine
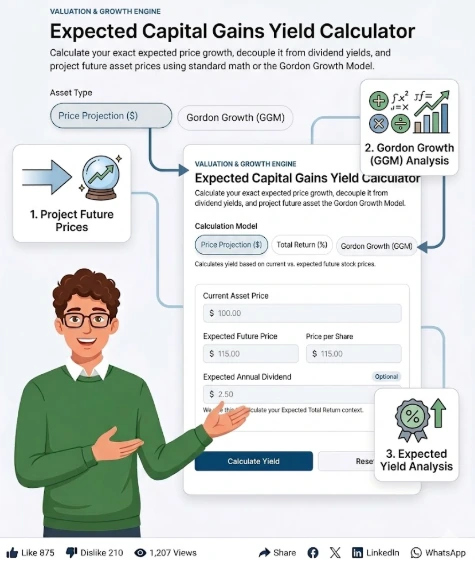
Expected Capital Gains Yield Calculator
Calculate your exact expected price growth, decouple it from dividend yields, and project future asset prices using standard math or the Gordon Growth Model.
Calculates yield based on current vs. expected future stock prices.
Expected Capital Gains Yield
Total Expected Return:
Total Yield Composition
Is expected capital gains yield the same as the growth rate?
Can capital gains yield be negative?
Explore More Calculators
Gross returns are a massive trap. Most investors ignore hidden fees and inflation. Uncover your exact net profit with our return on investment calculator.
Try calculatorCalculate your exact adjusted basis with this free cost basis calculator. Track stock DRIPs, crypto DCA, and real estate depreciation to lower taxes.
Try calculatorUse our free Stock Split Calculator to find your exact post-split share price, total holdings, and tax cost basis. Calculate fractional cash payouts instantly.
Try calculatorExplore Related Tools
Which Valuation Model Fits Your Data?
Different financial assets require different valuation math. A retail investor forecasting a specific tech stock price needs standard linear projection. A finance student evaluating mature dividend-paying companies requires the Gordon Growth Model to extract implied returns. Choose the correct method below to match your portfolio strategy.
| Calculation Model | Best For | Required Input Data | Real-World Purpose |
|---|---|---|---|
| Price Projection | Retail Investors | Current price, expected future price. | Measures the exact dollar-based growth percentage between two distinct price points over time. |
| Total Return Extraction | Mutual Fund Owners | Expected total return, dividend yield. | Strips the cash dividend yield completely out of an overall blended return percentage. |
| Gordon Growth (GGM) | Financial Analysts | Current stock price, next dividend, required return. | Calculates the implied constant growth rate (g) using complex corporate dividend discounting models. |
Heads-up: The Gordon Growth Model assumes corporate dividends grow at a constant, infinite rate. This mathematical model fails when valuing volatile startup companies.
What Your Expected Capital Gains Yield Means
Your “Left to Assign” number reveals your exact budget accuracy before the month begins. This figure represents the gap between your total income and your planned expenses. It proves whether you have assigned every single dollar a specific job.
Understanding Your Result
This number exposes your financial reality on paper. It tells you exactly how much cash is floating around without a purpose. Idle money creates financial stress because it usually disappears on random impulse purchases.
This result acts as an early warning system. It shows you a planning error before you actually spend the money. Fixing this number guarantees your paycheck will cover your Four Walls and fund your goals.
Is Your Result Good or Bad?
A perfect zero means excellent financial health. You successfully assigned every dollar a job. Your income perfectly matches your planned outgoing cash. You have total control over your monthly cash flow.
A positive number means idle cash is sitting in your account. You have not finished budgeting. Leaving money unassigned is bad because it slows down your wealth building.
A negative number signals immediate danger. You are planning to spend money you do not have. This situation forces you to rely on credit cards to cover basic bills. You must fix this imbalance instantly.
What You Should Do Next
- If your result is exactly zero: Stop budgeting. Follow your plan and track your expenses throughout the month to ensure you stick to these exact limits.
- Hold growth assets in taxable accounts: You defer taxes completely until you decide to sell the appreciating shares.
- Reinvest in positive yield assets: Move your capital into investments showing steady price appreciation to build sustainable equity.
How do you spot a high dividend value trap?
Retail investors often ignore shrinking equity when chasing massive cash payouts. Let’s look at how the Total Return model exposes this issue.
Input:
You expect a 4.0% Total Return and a 7.0% Dividend Yield.
Process:
The calculator mathematically strips the massive 7.0% cash payout away from the overall 4.0% performance expectation.
Result:
Expected Capital Gains Yield: -3.00%.
Meaning:
The underlying asset is actively decaying. The large dividend payment artificially masks a sinking principal balance, which destroys your long-term equity.
How to Use the Expected Capital Gains Yield Calculator
This calculator isolates your true price appreciation from dividend payments. Choose your preferred financial model and enter your current metrics. The system then calculates your expected growth and projects future asset values automatically.
Select a Calculation Model
Choose the financial method that fits your available data. The price projection mode requires specific dollar amounts. The total return mode uses percentage estimates. The Gordon Growth model evaluates mature dividend stocks using required rates.
Log Your Baseline Metrics
Type in your current asset price or your expected total return percentage. The system uses this starting value as the foundation for the math. It prepares the engine to extract your true underlying growth accurately.
Add Your Future Targets
Input your expected future price or your required rate of return. The calculator merges these new numbers with your original baseline. It then calculates the exact difference to find your overall price movement.
Review the Yield Extraction
The system mathematically strips the dividend payouts away from your total expected return. You immediately see your isolated capital gains yield. A visual bar chart appears to compare your price appreciation directly against your cash dividends.
Check Future Projections
The math engine applies your new capital gains yield to forecast future asset valuations. Review the one, three, and five-year compounding timelines. This shows exactly how your wealth builds over time if the growth rate holds steady.
How do you calculate capital gains yield from a standard price projection?
Read the current and future price targets for your asset. You must isolate the price growth from any dividends paid out during that period. This step frequently confuses retail investors analyzing their portfolio returns.
This classic scenario compares price growth against cash payouts. Use these inputs in the calculator:
Current Asset Price: $150.00
Expected Future Price: $165.00
Expected Annual Dividend: $3.00
Process:
The formula finds the price difference and divides it by the original price.
- Price Difference: $165.00 minus $150.00 equals $15.00.
- Capital Gains Yield: $15.00 divided by $150.00 equals 0.10.
- Dividend Yield: $3.00 divided by $150.00 equals 0.02.
Final Result:
Expected Capital Gains Yield: +10.00% Total Expected Return: 12.00%
Meaning:
The asset generates a 10% return strictly through price appreciation. You are building equity completely independently of the 2% cash dividend.
Accuracy Behind the Valuation Engine
Basic calculators lump all returns into one vague number. Our engine systematically decouples your yields to reveal true performance. It applies standard financial forecasting and the Gordon Growth Model to isolate exact price appreciation. This approach matches strict institutional analysis standards and prevents misleading dividend data from inflating growth estimates.
Key Features & Benefits
- Extracts pure capital appreciation from total expected returns automatically.
- Visualizes dividend yield versus capital gains yield for clear comparisons.
- Calculates implied constant growth rates using standard Gordon Growth equations.
- Projects compound asset values over precise one, three, and five-year timelines.
- Flags negative growth traps where high cash payouts mask principal loss.
Technical Process
Data Input
Logs your baseline prices, target metrics, and dividend payouts securely.
Logic Processing
Mathematically strips dividend yields away from the total expected return.
Output Generation
Applies the isolated capital gains yield to forecast future asset valuations.
How the Expected Capital Gains Yield Formula Works (Complete Breakdown)
Expected capital gains yield is the projected percentage increase in an asset’s market price over time. This calculation completely ignores cash dividends to isolate your true principal growth. Understanding these core equations helps investors measure actual market appreciation safely and avoid dangerous value traps.
Explaining the Expected Capital Gains Yield Formula
The expected capital gains yield formula mathematically strips cash payouts away from overall investment performance. The price projection equation calculates the difference between two specific dollar amounts to find a growth percentage. The extraction equation simply subtracts dividend yields from a total return percentage. Meanwhile, the Gordon Growth model derives the implied growth rate using a required minimum investor return.
					Price Projection Model:
Capital Gains Yield = ((Expected Future Price - Current Price) / Current Price) * 100

Total Return Extraction Model:
Capital Gains Yield = Expected Total Return - Expected Dividend Yield

Gordon Growth Model:
Capital Gains Yield = Required Rate of Return - (Next Dividend / Current Price)
Expected Capital Gains Yield Variables Breakdown
Each variable in the expected capital gains yield calculation measures a specific aspect of asset valuation. Defining these exact inputs reveals how much your investment price shifts over time.
Current Price
This represents the exact dollar amount your investment trades for today. It acts as the mathematical starting point for all growth measurements to find your true expected yield.
Expected Future Price
This marks your target selling price at the end of the holding period. A higher target directly increases your calculated profit margin and measures the anticipated value jump.
Expected Total Return
This combined percentage includes your anticipated price growth and your cash dividends. The math engine uses this baseline figure to strip out cash flow and find pure appreciation.
Expected Dividend Yield
This reflects the percentage of your investment paid back as cash over one year. Subtracting this metric from your overall return immediately isolates your actual capital gains generated.
Next Dividend
This is the estimated cash payout for the upcoming twelve months. Analysts plug this exact figure into the Gordon Growth equation to forecast long-term valuation trends.
Required Rate of Return (k)
This sets the absolute minimum percentage profit you demand to accept market risk. The Gordon Growth equation relies on this required rate to extract the implied growth percentage mathematically.
Another Example Calculation (Step-by-Step)
Expected Capital Gains Yield Calculation
Let us see how the Gordon Growth Model isolates implied growth using a real stock valuation scenario. This helps you understand how current market prices relate directly to required investor returns.
Given:
- Current Stock Price = $60.00
- Next Year’s Dividend = $3.00
- Required Rate of Return = 12.0%
Calculation:
					Dividend Yield = ($3.00 / $60.00) * 100 = 5.0%
Capital Gains Yield = 12.0% - 5.0% = 7.0%
Result:
- Expected Capital Gains Yield: 7.0%
- Total Expected Return: 12.0%
Meaning:
The market expects the stock price to grow by 7 percent annually. Generating the remaining 5 percent relies completely on the cash dividend payout. This confirms the asset offers solid capital appreciation alongside its steady income stream.
What is Capital Gains Yield?
Capital gains yield is the projected percentage increase in an asset’s market price over a specific period. It measures how much your core principal grows in value. This financial metric ignores cash dividends entirely. Investors use it to track pure market appreciation.
Total expected return combines two different wealth sources. You receive cash payouts from dividends, and you gain equity from price growth. Capital gains yield only tracks the price growth. It isolates your paper wealth from your direct cash income.
Many technology companies refuse to pay dividends. Managers reinvest all profits back into the business to develop new products. This internal funding forces the stock price to climb higher. Buying a pure growth stock means your entire return relies on capital gains.
Think about buying a vintage comic book for $100. It pays no monthly income while sitting on your shelf. Ten years later, collectors value it at $500. Your profit generates entirely from the item becoming more desirable. That massive price jump represents your capital gains yield.
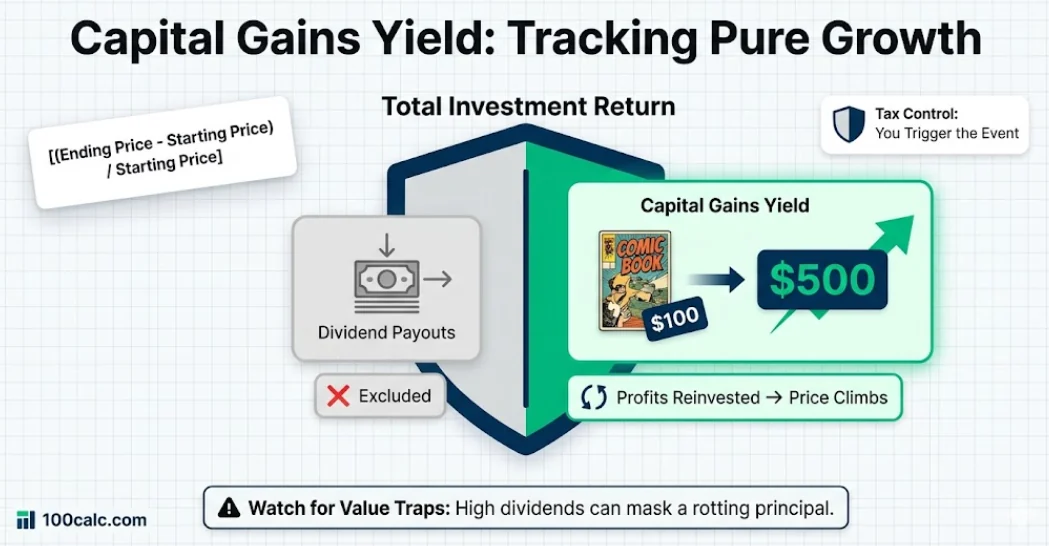
Why this matters
A high capital gains yield delays your tax burden. You control exactly when to sell the asset and trigger a taxable event. Understanding this metric also helps you avoid dangerous value traps where massive dividends mask a rotting principal balance.
How do you calculate expected capital gains yield?
You calculate expected capital gains yield by dividing the projected price increase by your original purchase price. If your asset pays cash distributions, you must subtract that dividend yield from your total expected return to isolate your pure market appreciation.
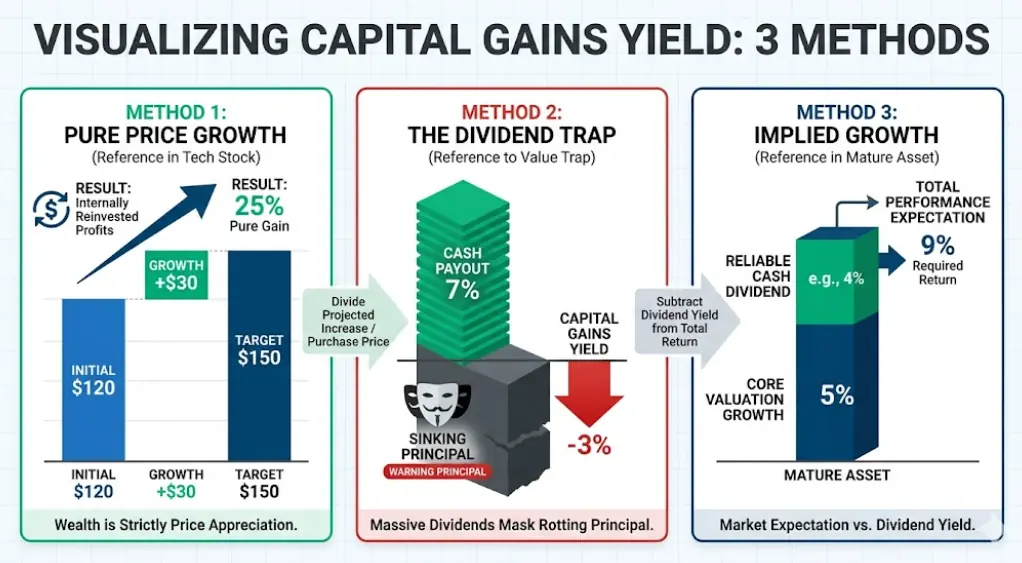
How do you forecast a pure tech growth stock?
Many modern technology companies refuse to pay cash dividends to their shareholders.
Use these inputs in the calculator:
- Calculation Model: Price Porjection($)
- Current Asset Price: $120.00
- Expected Future Price: $150.00
- Annual Dividend: $0.00.
Process:
The system subtracts the $120 baseline from the $150 target to find a $30 increase. It divides $30 by $120 to extract the pure growth percentage.
Result:
- Expected Capital Gains Yield: 25.00%.
- Total Return: 25.00%.
Meaning:
This company reinvests all profits internally. Your entire wealth accumulation comes strictly from the stock price climbing higher over time.
How do you spot a high dividend value trap?
Retail investors often ignore shrinking equity when chasing massive cash payouts.
Use these inputs in the calculator:
- Calculation Model: Total Return(%)
- Expected Total Return: 4.0%
- Expected Dividend Yield: 7.0%.
Process:
The calculator mathematically strips the massive 7.0% cash payout away from the overall 4.0% performance expectation.
Result:
- Expected Capital Gains Yield: -3.00%.
Meaning:
The underlying asset is actively decaying. The large dividend payment artificially masks a sinking principal balance, which destroys your long term equity.
How do you find implied growth for a mature asset?
Stable utility or banking stocks require standard corporate valuation modeling to assess true potential.
Use these inputs in the calculator:
- Calculation Model: Gordon Growth (GGM)
- Current Stock Price: $50.00
- Next Year Dividend: $2.00
- Required Return: 9.0%.
Process:
The engine divides the $2.00 dividend by the $50.00 price to find a 4.0% dividend yield. It then subtracts 4.0% from your 9.0% required return.
Result:
- Capital Gains Yield: 5.00%.
Meaning:
The market expects this established company to grow its core valuation by 5 percent annually. This baseline growth happens alongside its steady cash payouts to shareholders.
Quick Valuation Rules to Remember
Always separate your paper wealth from your actual cash income. High dividends cannot fix a sinking stock price. Check your isolated capital gains yield before holding any asset for years. Enter your portfolio numbers into the calculator above to test your real market appreciation right now.
Expected Capital Gains Yield Result Benchmarks
Your expected capital gains yield shows you exactly how much pure wealth your investment generates. It strips away the noise of cash dividends. Institutional investors and retail analysts rely on specific growth ranges to determine if an asset is a strong hold or a dangerous value trap. Here is a quick breakdown to help you evaluate your portfolio growth.
| Yield Range | Category | Market Meaning | Strategy Notes |
|---|---|---|---|
| Negative (< 0%) | Capital Loss | The asset is actively losing core market value over time. | High dividend payouts may be masking a decaying business model. Sell consideration. |
| 0% – 3% | Stagnant Growth | The stock price is barely moving above inflation rates. | Total return relies almost entirely on dividend distributions. Monitor closely. |
| 4% – 10% | Standard Growth | Healthy market appreciation tracking close to historical index averages. | Strong core holding for long-term equity building and wealth accumulation. |
| 11%+ | High Capital Growth | Aggressive price expansion characteristic of tech or growth sectors. | Asset generates massive tax-deferred wealth. Hold in taxable accounts to delay IRS impact. |
Heads-up: Growth expectations vary heavily by economic sector. A 3% yield might be excellent for a mature utility company but terrible for a modern tech firm.
Interpretation
A negative expected capital gains yield is the biggest red flag in investing. It means your core principal is shrinking. A yield between 4% and 10% represents a solid, appreciating asset that builds long-term equity. Yields above 11% highlight aggressive growth stocks where investors profit entirely from massive price expansion rather than cash payouts.
Pro Tip
Never let a massive dividend yield trick you into holding a negative capital gains asset. You are simply getting your own shrinking money handed back to you. Calculate the pure growth rate first, then consider the dividend as a bonus.
What to Do After Using the Expected Capital Gains Yield Calculator
Your isolated growth metrics should immediately drive your next portfolio moves. Corporate dividend policies often distort how retail investors perceive total performance. Use the insights below to adjust your tax strategy and portfolio allocation based entirely on your specific market appreciation result.
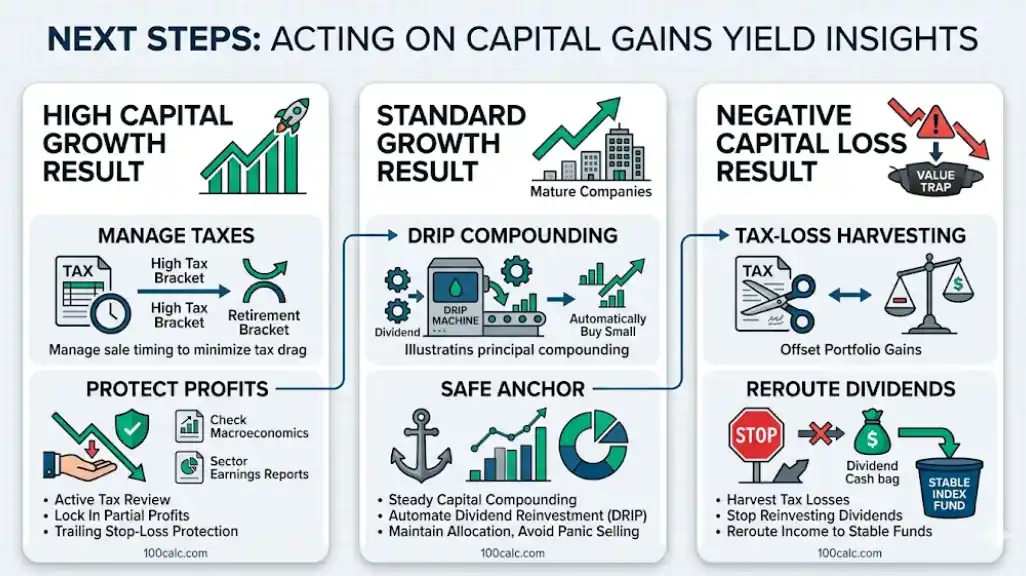
For High Capital Growth Results
Review your taxable accounts immediately if you hold massive pure-growth assets. You must actively manage when you sell these shares to avoid hitting the maximum 20 percent long-term bracket. Pushing off the sale until your core income drops in retirement can legally eliminate thousands of dollars in federal tax drag.
Do not blindly chase aggressive growth indefinitely without locking in partial profits. Evaluate the current macroeconomic environment and upcoming sector earnings reports. Massive price surges often trigger deep market corrections, so setting trailing stop-loss orders protects your pure capital gains from sudden trend reversals.
For Standard Growth Results
Check your asset allocation to ensure this steady growth matches your timeline. These mature holdings provide excellent foundation equity alongside reliable cash dividends. You should consider setting up an automated Dividend Reinvestment Plan (DRIP) to buy fractional shares quietly while your core principal steadily compounds.
Treat this moderate growth as the safe anchor for your overall wealth strategy. Avoid the temptation to sell these consistent performers to chase risky tech valuations. Maintaining these solid assets through volatile market cycles prevents panic selling when high-growth sectors inevitably crash.
For Negative Capital Loss Results
Prepare for immediate tax-loss harvesting if the company continues losing core value. The IRS allows you to offset your winning portfolio gains by selling these decaying assets at a loss. Selling your depreciated shares before the calendar year ends actively lowers your total tax burden while freeing up trapped cash.
Stop reinvesting any cash dividends back into this sinking asset immediately. Pumping fresh money into a value trap accelerates your overall wealth destruction. Reroute that dividend income into stable index funds to slowly rebuild your baseline equity safely.
You Might Also Find These Helpful
Investment 3
No tools published here yet.
Related Tools People Use Next
Common Mistakes When Calculating Expected Capital Gains Yield
Calculating pure asset appreciation requires exact mathematical inputs. Small data entry errors or misunderstanding basic financial terminology will completely ruin your portfolio forecast. Many retail investors enter the wrong yield types or confuse their future tax liabilities with their actual market growth.
- Confusing expected capital gains yield with the actual cash amount owed for capital gains tax.
- Typing total return percentages into the expected dividend yield input field by mistake.
- Assuming a high dividend payout ratio guarantees strong market growth for the underlying business.
- Trying to calculate regional property sales taxes instead of standard stock market price appreciation.
- Mixing up long-term Compound Annual Growth Rate forecasting with single-period yield metrics.
Frequently Asked Questions (FAQs)
How do you calculate the capital gains yield?
Divide your expected cash dividend by the current stock price to find your dividend yield. Subtract that specific percentage directly from your total expected return. The remaining figure represents your exact capital gains yield without any cash distortion.
This isolates your pure market appreciation. It gives you a clear view of how much your core investment is actually growing.
What is the formula for the expected capital gains yield?
You subtract your current asset purchase price from your expected future selling price. Divide that exact mathematical result by your current baseline price. Multiply that final decimal by 100 to extract your true growth percentage for the year.
You can also calculate this by subtracting your expected dividend yield directly from your total expected return.
Is capital gains yield the same as dividend yield?
No. Capital gains yield measures the percentage increase in the actual market price of your investment. Dividend yield measures the physical cash paid directly to shareholders. These two metrics track completely different sources of investment wealth.
Adding both of these separate numbers together gives you your total expected return.
Is it better to have capital gains or dividends?
Capital gains offer superior tax control for most long-term retail investors. You delay paying taxes entirely until you finally decide to sell the appreciating asset. This allows your entire principal balance to compound without yearly tax drag.
Dividends force you to pay taxes every year on the cash you receive. This slows down your overall compound growth.
Why is capital gains yield considered highly volatile?
This yield is highly volatile because it depends entirely on shifting market valuations. Macroeconomic issues, inflation rates, and investor confidence constantly alter daily stock prices. These external factors swing your paper wealth up and down rapidly.
Dividends remain much more stable because corporate boards set them in advance regardless of daily market panics.
How does dollar-cost averaging affect capital gains yield?
Dollar-cost averaging lowers your overall purchase price when market values drop. Buying shares steadily during a temporary market downturn directly reduces your average cost basis. This proven strategy positions your entire portfolio for maximum percentage growth.
A lower initial cost basis mathematically increases your future capital gains yield once the market finally recovers.
What is the 20 percent rule for capital gains?
The IRS applies a 20 percent maximum tax rate on long-term capital gains for high-income earners. You trigger this top bracket only when your total taxable income exceeds specific federal limits set for the current year.
Holding an asset for over one full year qualifies you for these preferred long-term tax rates.
How much capital gains tax will I pay on $300,000?
Your final tax bill depends completely on your total taxable income and filing status. Most single filers earning this specific amount fall directly into the 15 percent long-term capital gains bracket under current tax laws.
This creates a $45,000 federal tax liability if the entire amount comes from qualified investment profits.
What is the 25 percent dividend rule?
This corporate finance rule suggests companies should only pay out 25 percent of their total earnings as cash dividends. Managers must reinvest the remaining 75 percent to fuel internal business growth, research, and future development.
This aggressive reinvestment strategy usually drives the stock price higher and increases your overall capital gains yield.
How long do you have to keep dividends to avoid capital gains tax?
You cannot avoid taxes entirely, but you can secure the lower long-term capital gains rate. You must hold the underlying stock for more than 60 days during the 121-day period surrounding the ex-dividend date. This transforms standard payouts into qualified dividends.
How much money do you need to make $100,000 a year in dividends?
You need an invested portfolio of 2.5 million dollars assuming a safe 4 percent average dividend yield. Pushing for a 5 percent yield lowers your required capital to 2 million dollars. Chasing yields higher than that usually increases your risk of severe capital loss.
What does Warren Buffett say about dividends?
Buffett refuses to pay cash dividends to his own Berkshire Hathaway shareholders. He prefers reinvesting all corporate profits internally to generate massive capital gains over time. However, he loves collecting huge cash dividend payouts from the established consumer companies his holding firm buys.
At what point should I stop reinvesting dividends?
You should stop automatically reinvesting your dividends when you officially retire and need liquid cash flow to cover your daily living expenses. You must also turn off reinvestment if a single stock grows too large and throws your overall portfolio allocation out of balance.
Do billionaires get dividends?
Yes. While many modern tech founders rely entirely on pure capital gains, traditional billionaires collect massive cash payouts. Investors like Bill Gates and Warren Buffett receive hundreds of millions of dollars annually in passive dividend income from their massive corporate equity holdings.
How do you calculate capital gains yield in Excel?
Enter your current purchase price in cell A1 and your expected future selling price in cell A2. In cell A3, type the formula =(A2-A1)/A1 and format the cell as a percentage. This instantly calculates your exact capital gains yield without any dividend distortion.
Questions?
We had love to hear from you! Whether you are reporting an issue, suggesting a new calculator, or exploring collaboration opportunities — we are here to help. Every message helps us make 100calc smarter, faster, and more helpful for everyone.
Why People Trust 100calc
At 100calc.com, we focus on accuracy, speed, and trust. Every calculator we create is designed to give reliable, instant, and easy-to-understand results you can truly depend on.