Investment Calculators for Clearer Money Moves
Investment calculators help you estimate returns, compare stock changes, check cost basis, review capital gains yield, and understand how your money may grow over time. Instead of guessing from scattered formulas or spreadsheets, you can choose the right tool for the exact investment question in front of you.
Most users don’t just want “one investment calculator.” They want to know: Will this return make sense? What happens after a stock split? What is my real cost basis? How much gain could I expect?
Use this page to browse simple investment tools for ROI, stocks, cost basis, capital gains, and future investing decisions.
- Fast estimates
- Clear formulas
- Updated regularly
Choose the Right Investment Calculator
Pick a calculator based on your goal. Check ROI, stock splits, cost basis, capital gains yield, or other investment numbers without hunting through formulas. Each tool helps answer one money question fast.
Investment 4
Gross returns are a massive trap. Most investors ignore hidden fees and inflation. Uncover your exact net profit with our return on investment calculator.
Try calculatorHigh dividends often mask decaying stock prices. Use our expected capital gains yield calculator to isolate true growth and avoid risky value traps.
Try calculatorCalculate your exact adjusted basis with this free cost basis calculator. Track stock DRIPs, crypto DCA, and real estate depreciation to lower taxes.
Try calculatorUse our free Stock Split Calculator to find your exact post-split share price, total holdings, and tax cost basis. Calculate fractional cash payouts instantly.
Try calculatorRelated Tools People Use Next
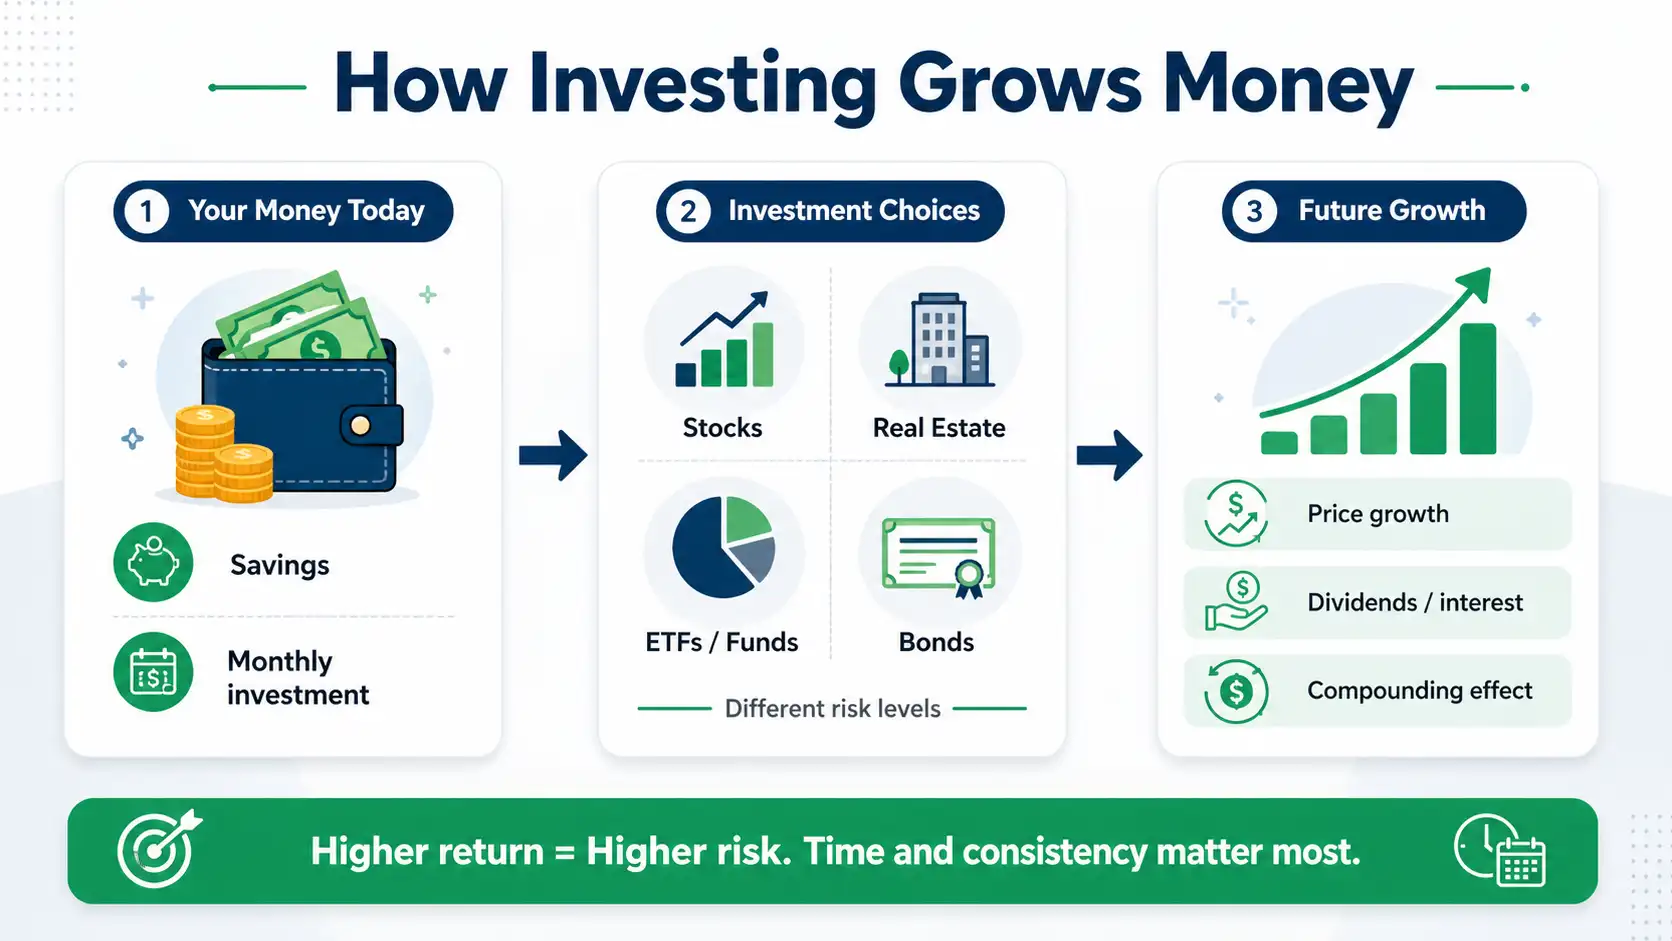
What is Investment?
Investment is putting money into assets like stocks, funds, or real estate with the expectation of earning a financial return over time through growth, income, or compounding.
At its core, investing turns today’s money into future value. You might buy company shares, invest in an index fund, hold bonds, or spread money across different assets to balance risk and return.
Returns do not move in a straight line. Market changes, timing, and risk level can shift outcomes. Some investors focus on steady income like dividends or interest. Others aim for long-term price growth. The approach depends on your goal and time horizon.
For example, one person invests $300 each month into an S&P 500 index fund for 15 years. Another buys a single stock and waits for price growth. Both invest, but the path, risk, and expected outcome are very different.
Micro Insight
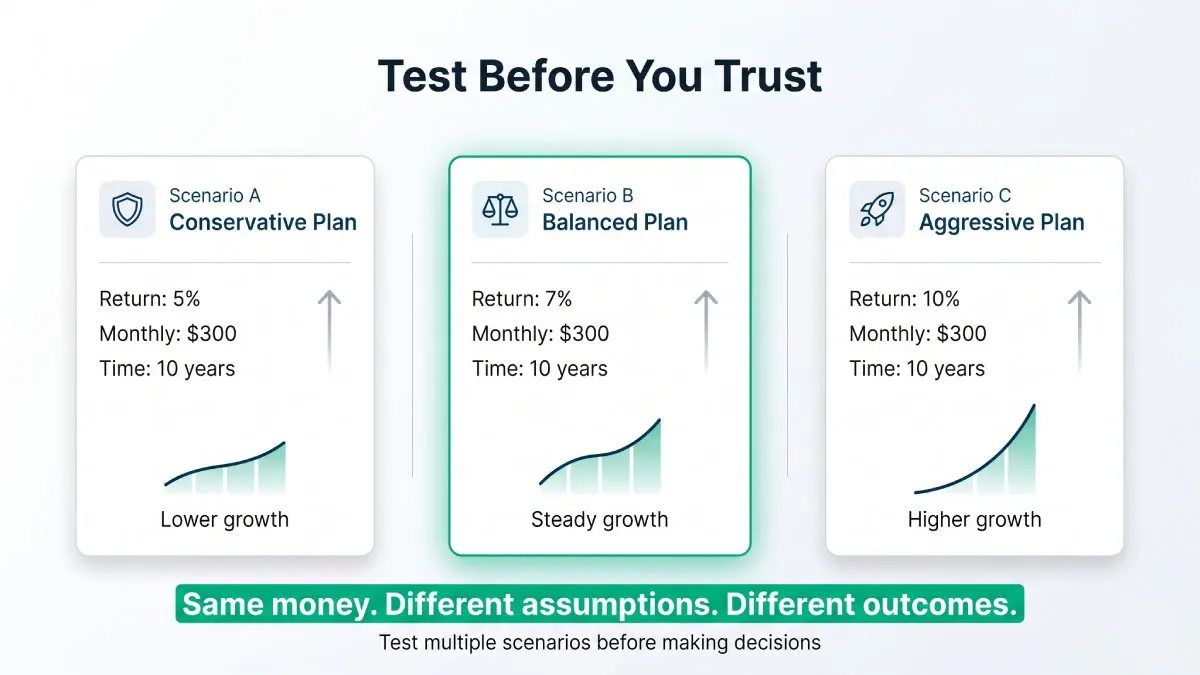
Investment results are shaped by small inputs. A change in return rate, time period, fees, or inflation can shift long-term outcomes. Testing different scenarios helps you see what is realistic before you commit money.
What Investment Calculators Help You Check Before Money Moves
Investment calculators help you test the numbers behind real investing choices. You can compare returns, stock changes, cost basis, capital gains yield, withdrawals, and long-term growth assumptions. Most users need two things: the right task and the right inputs.

Key Tasks Users Perform
Compare possible returns
Check ROI, capital gains yield, and expected growth before choosing an investment.
Test contribution plans
Review monthly investment, lump sum, SIP, and long-term growth scenarios.
Understand stock changes
See how stock splits, share count, purchase price, and sale price affect results.
Plan money movement
Estimate withdrawals, cost basis, taxes, and inflation-adjusted return before acting.
Core Inputs Used
Investment amount
Starting balance, lump sum amount, or monthly contribution.
Return assumption
Expected return rate, S&P 500-style estimate, or real return after inflation.
Stock details
Purchase price, current price, number of shares, and split ratio.
Timing and location
Investment length, contribution frequency, currency, and country rules.
How Our Investment Calculators Turn Your Inputs Into Real Decisions
Investment calculators convert your inputs into projected outcomes using time-based growth, return assumptions, and value comparisons. Each tool isolates one decision. Growth, ROI, cost basis, or stock adjustment. This avoids confusion and keeps results tied to a single clear question.
How Inputs Become Results You Can Actually Use
Investment calculators take your inputs and map them through a specific calculation path to produce a focused output. A growth tool projects future value. An ROI tool compares gain against cost. A stock split tool adjusts shares and price.
Different inputs lead to different outputs. That is why each calculator solves one scenario instead of mixing everything together.
Insight: When inputs match your real situation, the output becomes a decision tool, not just a number.
Why One Investment Formula Never Tells the Full Story
Investment calculations rely on different logic types. Some use percentage-based returns. Others depend on time-based compounding, value comparison, or adjustment logic for stock events.
No single formula fits every case. Growth, withdrawals, and stock changes all follow different paths. Mixing them creates misleading results.
Insight: The right calculation model matters more than the formula itself.
Why Accurate Inputs Matter More Than the Calculator
Results are only as reliable as the inputs behind them. Return rate, time horizon, contribution timing, and price movement all shape the final estimate. Small changes in these values can shift long-term projections in a big way.
External factors also play a role. Inflation, fees, taxes, and dividends can change what your investment actually delivers.
Insight: A small input change today can create a large gap in future results.
When Investment Results Look Right but Feel Wrong
Results can vary when assumptions do not match real market behavior. Fixed return rates rarely reflect actual market movement. Withdrawals, irregular contributions, and price volatility can change outcomes over time.
Currency differences and country-specific rules also affect interpretation. What works in one region may not translate directly to another.
Insight: Treat every result as a scenario, not a guaranteed outcome.
How These Tools Evolve With Real User Behavior
Investment calculators improve as user behavior changes. New tools are added when users search for specific scenarios like monthly investing, SIP, lump sum growth, or withdrawal planning.
Updates focus on clarity, better input handling, and results that reflect real-world decisions rather than abstract math.
Insight: Tools improve when they reflect how people actually invest, not how formulas are written.
Important note: Results are estimates. For major decisions, verify with a qualified professional.
What Counts as a “Good” Investment Result? Benchmarks Most People Misread
Most users ask the same thing before using investment calculators. Is this return good or bad? Should I expect more? Benchmarks help you judge results without guessing. They also stop you from chasing unrealistic returns or trusting numbers that look good but are not practical.
| Range | Label | USA Guideline | India Guideline | Notes |
|---|---|---|---|---|
| 10%+ annually | High Growth | Seen in long-term stock market averages like S&P 500. | Possible in equities and aggressive mutual funds. | Not guaranteed. Expect ups and downs. |
| 5%–9% | Moderate | Common for balanced portfolios or index funds. | Seen in hybrid funds or long-term SIP investing. | Often realistic for long-term planning. |
| 2%–5% | Low Return | Typical for savings accounts or bonds. | Fixed deposits or low-risk instruments. | Safer but slower growth. |
| 0%–2% | Very Low | May not beat inflation over time. | Real value may decline due to inflation. | Used for short-term holding only. |
| Negative return | Loss | Common in market downturns or bad timing. | Seen in volatile equity or poor asset choice. | Check holding period before reacting. |
Heads-up: Returns vary by market, timing, and risk level. Always compare results with your investment goal, not just the percentage.
Before You Trust the Numbers. Smart Ways to Use Investment Calculators
- Use different return rates like 5%, 7%, and 10% to see best and worst outcomes
- Match the calculator to your goal. Growth, ROI, or stock changes are not the same
- Check results over longer periods. Short-term numbers often mislead
- Add or remove monthly contributions to test real-life investing behavior
- Compare multiple tools before making a decision, not just one result
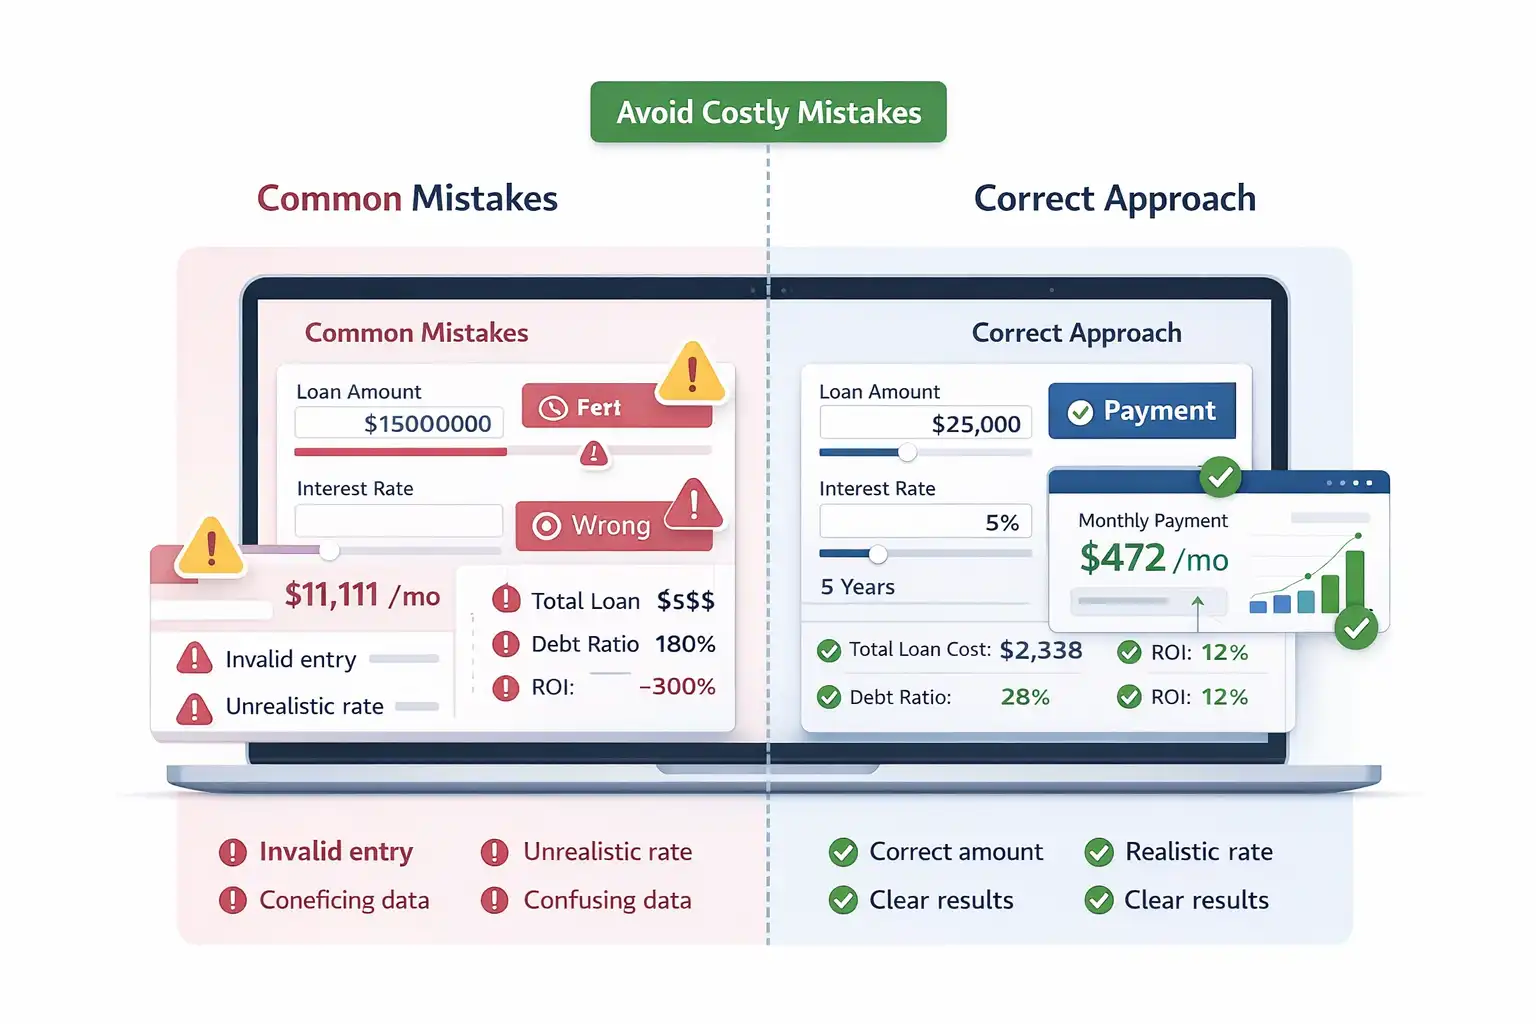
Why Most Investment Calculator Results Go Wrong (And How to Avoid It)
- Using one calculator for every scenario instead of choosing the right tool
- Entering unrealistic return rates like fixed 15% growth every year
- Ignoring inflation, fees, or taxes when judging final value
- Comparing lump sum results with monthly investment results
- Making decisions based on short-term results instead of long-term trends
Frequently Asked Questions (FAQs)
Which investment calculator should I use first?
Use the calculator that matches your goal. Start with an ROI calculator to check profit vs cost. Use a growth or monthly investment calculator for long-term planning. Choose stock split or cost basis tools when dealing with shares and taxes. If you are unsure, begin with ROI. It gives a quick snapshot before going deeper.
Can I use these tools before buying a stock?
Yes, investment calculators can help you test possible outcomes before buying a stock. You can check ROI, capital gains yield, stock split impact, or cost basis. They do not tell you what to buy. They help you understand the numbers first.
Are investment calculators accurate enough for planning?
Investment calculators are accurate for estimates when inputs are realistic. They use standard formulas like compound growth and return rates. Results depend on your assumptions, not the tool itself. Treat them as planning tools, not predictions. Always test multiple scenarios before making decisions.
Do investment calculators include taxes and fees?
Most simple investment calculators do not include taxes and fees unless they show those fields. This matters because fees can reduce growth over time. Taxes can also change your real gain when you sell an investment.
Should I use annual return or monthly return?
Use annual return in most cases. Many investment calculators are built around yearly growth rates. Entering a monthly rate in an annual field can inflate your results. Only use monthly return if the tool clearly asks for it. When in doubt, stick to annual percentage.
Can investment calculators include withdrawals?
Some calculators support withdrawals, but many do not. Use a withdrawal or retirement calculator when you want to see how long your money lasts. Growth calculators work better when you are adding money, not taking it out.
What return rate should I use for S&P 500 planning?
A common range is 7% to 10% annually. Many investors use 7% for conservative planning and 10% for long-term historical averages. Markets do not grow at a fixed rate each year. Test multiple rates to see best and worst scenarios before relying on a single estimate.
Is a 10% annual return benchmark still realistic in 2026?
Average market returns historically reach 8% to 10% over long periods. 2026 market data shows higher volatility due to AI sector shifts. High performance now often requires tracking specific tech growth and energy cycles. Reach your portfolio to the S&P 500 index every quarter. If your returns stay below 7%, consider diversifying into lower-fee index funds to protect your wealth.
How do dividend reinvestment plans affect investment growth?
Dividend reinvestment uses your cash payouts to buy more shares automatically. This process triggers compound growth without requiring new deposits from your bank. Most brokerage tools offer this feature for free to build long-term wealth. Reinvesting can increase your total portfolio value by 30% over ten years. Choose this option if you do not need immediate cash for daily expenses.
What is the difference between ROI and capital gains yield?
ROI compares total gain against the full investment cost. Capital gains yield focuses on price change, often for stocks. ROI can include broader costs and returns. Capital gains yield is narrower and works best when you only care about asset price growth.
Why do I need to track my expected yield?
Expected yield measures the income generated by your portfolio relative to its price. A yield between 2% and 4% is standard for stable dividend-paying companies. Investors seeking passive income prioritize high-yield stocks. Low yields often suggest the company reinvests cash for price growth. Consequently, use the yield result to decide if a stock meets your cash flow needs.
Can I use investment calculators for UK, India, Pakistan, or Canada?
Yes, basic investment math works across countries. The currency can change from dollars to pounds, rupees, or PKR. Local tax rules, fees, inflation, and investment products may change the real result, so use calculators as estimates.
How do I calculate the "real" ROI after 2026 inflation?
Subtract inflation from your expected return to get a rough real ROI. For example, if your investment returns 8% and inflation is 3%, your real return is about 5%. This gives a clearer view of purchasing power, not just growth on paper.
Questions?
We had love to hear from you! Whether you are reporting an issue, suggesting a new calculator, or exploring collaboration opportunities — we are here to help. Every message helps us make 100calc smarter, faster, and more helpful for everyone.
Why People Trust 100calc
At 100calc.com, we focus on accuracy, speed, and trust. Every calculator we create is designed to give reliable, instant, and easy-to-understand results you can truly depend on.
Ready to Calculate?
Pick a tool based on your goal, not guesswork. Check ROI, growth, stock changes, or withdrawals in seconds. You don’t need formulas or spreadsheets. Choose a calculator, enter your numbers, and see how your investment could play out before you decide.