Average Variable Cost Calculator: Stop Bleeding Cash on Every Sale
The average variable cost calculator finds the exact direct expense needed to produce one single item. It works by dividing your total variable costs by your total production quantity. This important metric ignores fixed overhead completely. It shows you the absolute minimum price floor required to keep your business running.
Are you accidentally losing money on every new order? Many owners unknowingly price products below their actual material and labor costs. This invisible cash leak destroys profit margins fast. Our tool exposes your true production expenses so you stop guessing. Used by students, business owners, and pricing teams to make smarter short-run decisions.
Enter your data below to get an instant cost breakdown. You will discover your exact shutdown point immediately. This helps you know precisely when it becomes cheaper to halt operations. Keep reading to learn how to use this number to scale safely.
Quick Facts
- Calculates direct cost per individual unit.
- Excludes fixed overhead bills like facility rent.
- Identifies your critical short-run shutdown point.
- Helps you set minimum pricing floors easily.
- Warns you when producing costs more than stopping.
- Updated Apr 30, 2026
- Reviewed by 100Calc Research Team
Calculate Your Average Variable Cost in Seconds
Select your market currency from the dropdown menu to begin. Type your total variable expenses into the first box. Enter your total production quantity right below it. The system processes these numbers immediately without requiring any complex setup. It reveals your exact cost per item and highlights your critical shutdown price. Add your values below to see your results instantly.
Explore More Calculators
Calculate price elasticity of demand instantly using the midpoint formula. Get accurate PED score, revenue impact, and real examples in seconds.
Try calculatorUse the Comparative Advantage Calculator to compare opportunity costs, find who should specialize, and avoid the table mistakes that flip answers.
Try calculatorUse this cross price elasticity calculator to see if products are substitutes or complements. Get instant results, % changes, and clear market insights in…
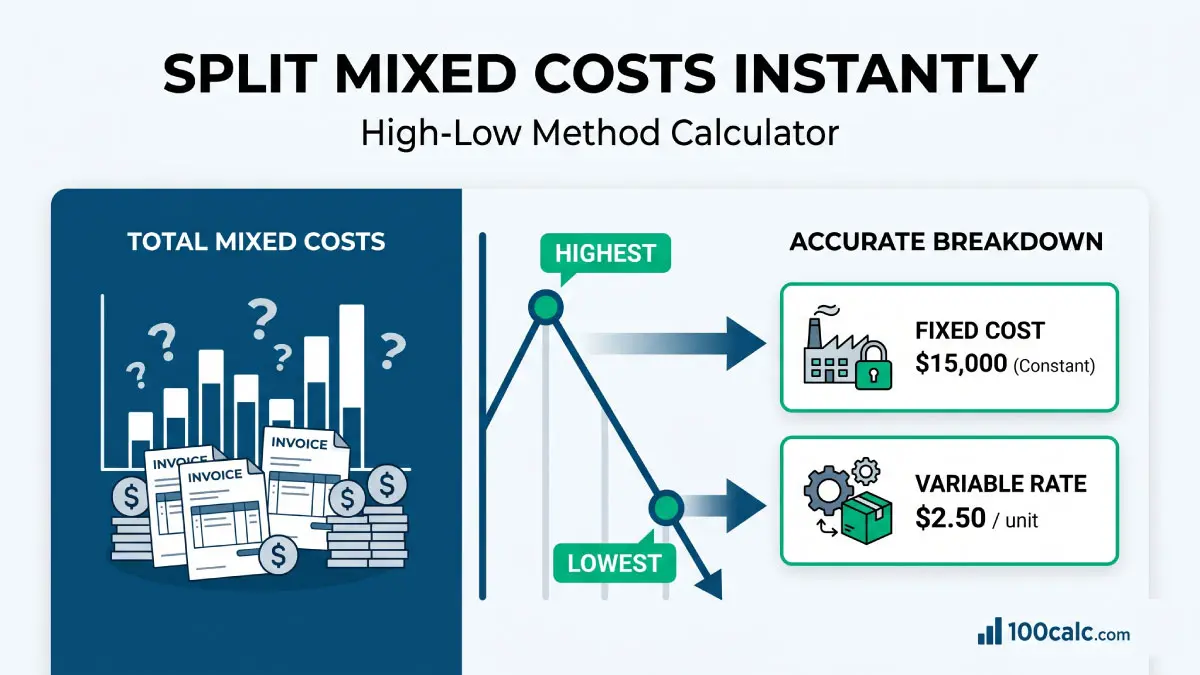
Try calculatorUse this High Low Method Calculator to find variable cost per unit, fixed cost, and projected total cost fast for budgeting, pricing, and planning.
Try calculatorUse this marginal cost function calculator to find cost per unit instantly. Enter change in cost and output to make smarter pricing decisions fast.
Try calculatorUse this marginal revenue calculator to find profit per unit fast. Compare cost, revenue, and output to make smarter pricing decisions instantly.
Try calculatorExplore Related Tools
What Your Average Variable Cost Result Means
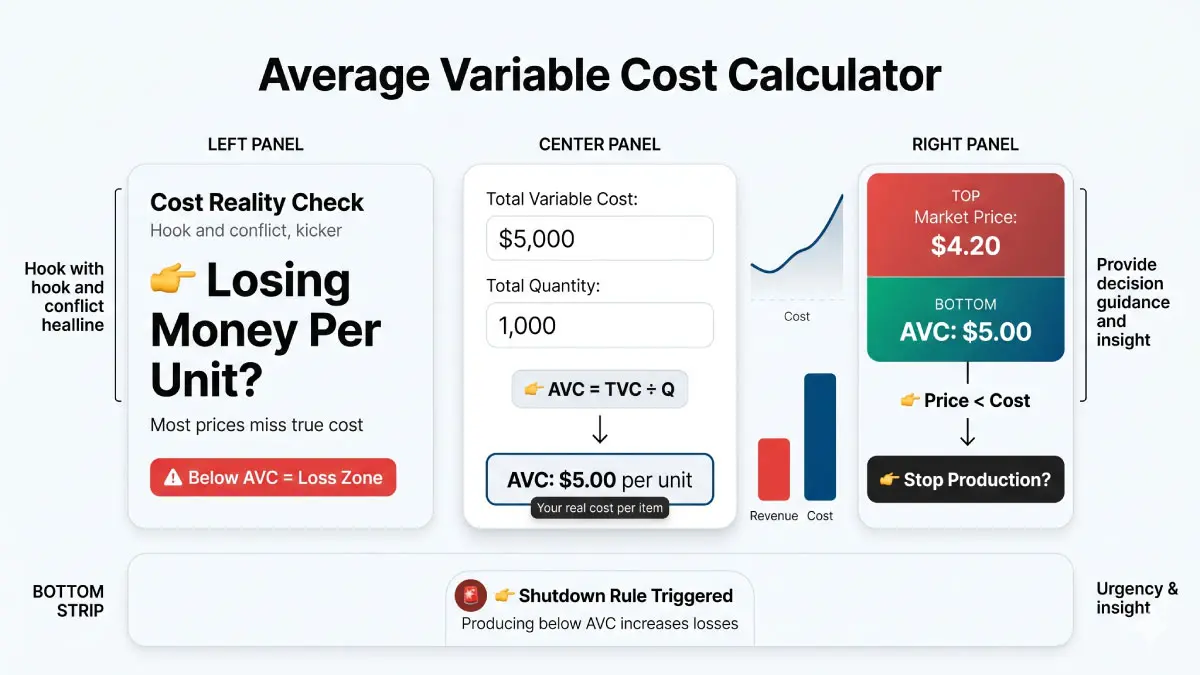
Your result reveals the direct cost to make a single product. It ignores all fixed bills like office rent or salaried managers. This number only includes the exact raw materials and hourly labor needed to create one more unit. The shutdown rule states that if price falls below average variable cost, a firm should stop production in the short run.
Understanding Your Result
This number is your absolute bottom line. It shows the minimum amount of cash you must spend to keep the factory running today. You must compare this number directly with your current selling price. If your product price sits above this number, you are covering your production expenses.
- If price is above AVC, production can continue in the short run.
- If price is below AVC, stopping production reduces losses.
Is Your Result Good or Bad?
There is no universal perfect number here. A “good” result simply means your average variable cost sits safely below your market selling price. That gap is your contribution margin. A “bad” result happens when your cost per unit creeps dangerously close to your selling price. This happens often during supply chain shortages or sudden material price spikes.
What You Should Do Next
Compare this number with your current selling price right away and confirm you still have enough margin to cover fixed costs like rent and insurance. Keep tracking this value each month because a sudden increase often signals rising material costs or lower efficiency. If market prices drop below your calculated result, treat it as a warning and pause production to avoid deeper losses.
A Quick Example to Test
Let’s say a local bakery makes organic sourdough bread.
- Total Variable Costs = $4,500 (flour, yeast, baker hourly wages)
- Total Quantity = 1,500 loaves
The calculator will divide $4,500 by 1,500.
Result:
Average Variable Cost = $3.00 per loaf.
Meaning:
The bakery must spend exactly $3.00 to bake one loaf of bread. If a new grocery store asks to buy loaves wholesale for $2.50 each, the bakery must decline the deal or risk going bankrupt.
How do you calculate the average variable cost?
To calculate average variable cost, divide total variable costs by total output. The result shows the variable cost per unit, not total cost. Economics sources and study discussions also use AVC as a short-run decision line because firms compare price with AVC when judging whether to keep producing.
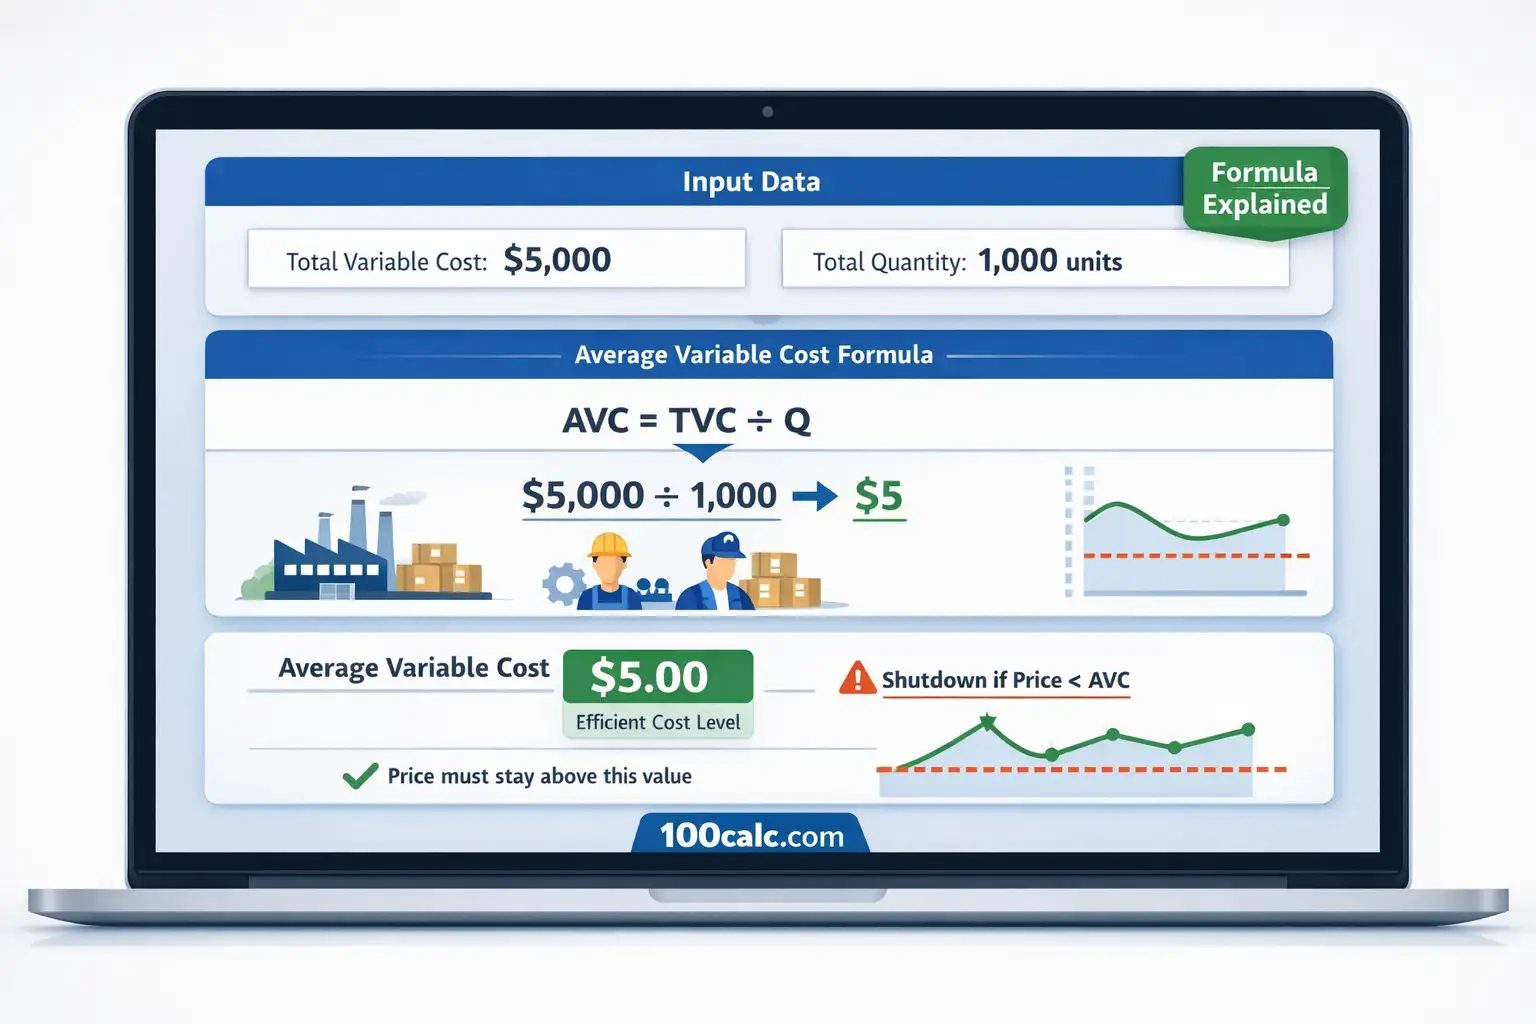
What happens when total variable cost is $5,000 and output is 1,000 units?
This is a clean base example for understanding the average variable cost formula. It shows how variable cost is spread across a larger production run.
Use these inputs in the calculator:
- Select Market: United States ($)
- Total Variable Costs: 5000
- Total Quantity: 1000
Expected output:
- Average Variable Cost: $5.00
- Total TVC: $5,000
- Total Units: 1,000
- Per Unit AVC: $5.00
- Region: US
- Status: VERIFIED
Expected interpretation:
Each unit carries $5.00 in variable cost. If market price falls below that amount, production no longer covers labor and material costs.
How do I calculate AVC when variable cost is ₹12,000 and output is 300 units?
This example works well for readers searching how do I calculate AVC or average variable cost formula with example. It also checks the market selector and currency update.
Use these inputs in the calculator:
- Select Market: India (₹)
- Total Variable Costs: 12000
- Total Quantity: 300
Expected output:
- Average Variable Cost: ₹40.00
- Total TVC: ₹12,000
- Total Units: 300
- Per Unit AVC: ₹40.00
- Region: IN
- Status: VERIFIED
Expected interpretation:
The business spends ₹40.00 in variable cost for each unit produced. Pricing must stay above that level to avoid operating at a short-run loss.
What does a higher average variable cost look like when TVC is £9,000 and output is 150 units?
A smaller output base with a large variable cost often produces a higher AVC. That usually signals weak cost efficiency or expensive production inputs.
Use these inputs in the calculator:
- Select Market: United Kingdom (£)
- Total Variable Costs: 9000
- Total Quantity: 150
Expected output:
- Average Variable Cost: £60.00
- Total TVC: £9,000
- Total Units: 150
- Per Unit AVC: £60.00
- Region: UK
- Status: VERIFIED
Expected interpretation:
Each unit costs £60.00 in variable expense. That is a warning sign if market price is close to or below that level.
How to find average variable cost from a table when TVC is ₨18,000 and quantity is 600 units?
This case mirrors a simple table-style economics problem. It is useful for users comparing variable cost across output levels.
Use these inputs in the calculator:
- Select Market: Pakistan (₨)
- Total Variable Costs: 18000
- Total Quantity: 600
Expected output:
- Average Variable Cost: ₨30.00
- Total TVC: ₨18,000
- Total Units: 600
- Per Unit AVC: ₨30.00
- Region: PK
- Status: VERIFIED
Expected interpretation:
Average variable cost is ₨30.00 per unit. That gives a clear benchmark for break-even pricing in the short run.
What is the average variable cost for a custom T-shirt printing business?
This reflects real ecommerce and print-on-demand businesses discussed in forums.
Use these inputs in the calculator:
- Select Market: United States ($)
- Total Variable Costs: 9600
- Total Quantity: 2400
Expected output:
- Average Variable Cost: $4.00
- Total TVC: $9,600
- Total Units: 2,400
- Per Unit AVC: $4.00
- Region: US
- Status: VERIFIED
Expected interpretation:
Each shirt costs $4.00 in ink, fabric, and labor. Pricing below this kills margins fast.
How does a food truck calculate average variable cost per meal?
A common real-world case from small food businesses.
Use these inputs in the calculator:
- Select Market: Canada ($)
- Total Variable Costs: 3750
- Total Quantity: 750
Expected output:
- Average Variable Cost: $5.00
- Total TVC: $3,750
- Total Units: 750
- Per Unit AVC: $5.00
- Region: CA
- Status: VERIFIED
Expected interpretation:
Each meal costs $5.00 in ingredients and fuel-linked costs. Selling below that creates immediate loss.
How do these examples help you understand average variable cost in economics?
These examples show how the average variable cost formula economics works in real production settings. Instead of reading theory only, users can see how total variable cost and total output create a per-unit cost figure that shapes pricing and shutdown decisions.
Quick rule to remember before using your numbers
Use costs and output from the same time period. Keep fixed costs out of the input. Most real confusion comes from mixing AVC with ATC, or using total cost instead of total variable cost. Search results and forum questions also show that users often care most about one comparison: market price versus AVC. Now plug in your numbers and test your situation.
How to Use the Average Variable Cost Calculator
This average variable cost calculator turns your total variable cost and output into a clear cost per unit. It shows exactly how much each unit costs and helps you decide if your pricing is safe or risky.
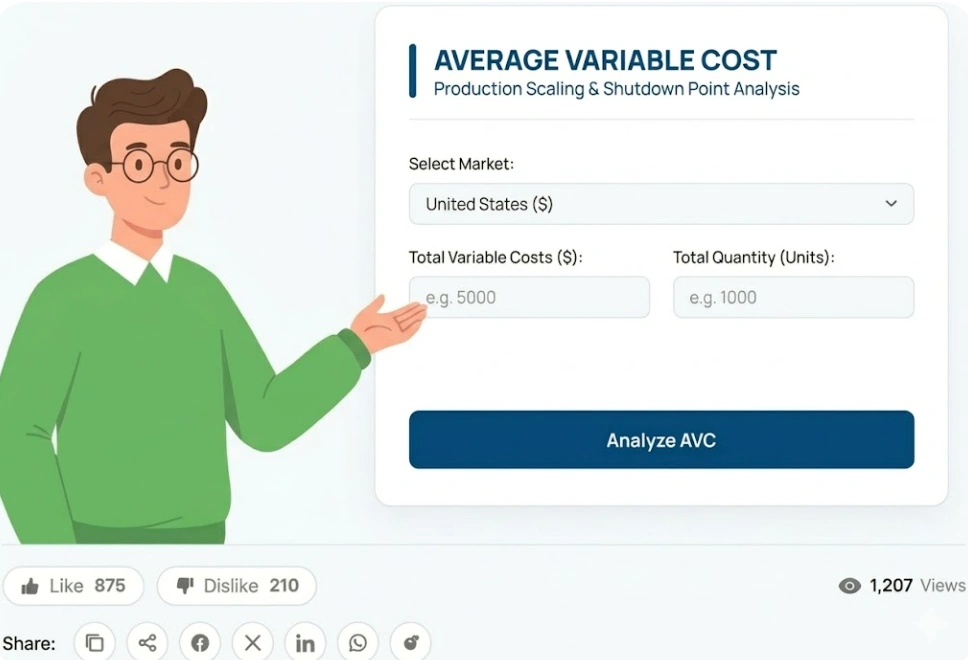
Select your market
Choose your market to set the currency symbol and region label. This step does not change the math. It only adjusts how values appear on screen so the final result matches your local pricing context.
Enter total variable cost (TVC)
Add the full variable cost for the period. This includes materials, hourly labor, fuel, and other usage-based expenses. The calculator stores this value as the total cost that will be spread across all produced units.
Enter Total Quantity Produced (Q)
Input the number of units produced in the same period. This value must be greater than zero. The system uses it as the base to distribute your total variable cost across each unit.
Click analyze AVC
Click calculate to divide total variable cost by total quantity. The calculator runs a simple division in the background. It converts one total number into a per-unit cost that reflects how much each item actually costs to produce.
Read the Result and Decision Signal
Review the result card and the note below it. The system shows your cost per unit, repeats your inputs, and highlights the shutdown rule. It compares your cost level with market price so you can judge if producing still makes sense.
What result should you expect when total variable cost is د.إ7,500 and output is 250 units?
This is a mid-range example that helps test the calculator in another regional market. It also fits readers looking for a practical average variable cost calculator example.
Use these inputs in the calculator:
- Select Market: UAE (د.إ)
- Total Variable Costs: 7500
- Total Quantity: 250
Expected output:
- Average Variable Cost: د.إ30.00
- Total TVC: د.إ7,500
- Total Units: 250
- Per Unit AVC: د.إ30.00
- Region: AE
- Status: VERIFIED
Expected interpretation:
Each additional unit carries an average variable cost of د.إ30.00. That becomes the minimum short-run price needed to cover variable expenses.
How the Average Variable Cost Calculator Formula Works (Complete Breakdown)
The Average Variable Cost Calculator uses one core formula to show your direct production cost per unit. It takes total variable costs and spreads them across total output. That is the exact logic used in the calculator. Search results and economics sources also show a related shortcut, AVC = ATC – AFC, but this tool calculates AVC directly from TVC and quantity.
What’s the formula for AVC?
					AVC = TVC ÷ Q

Alternative Relationship

AVC = ATC - AFC
What This Formula Does
This formula finds the variable cost attached to one unit of output. It takes the total spending that changes with production, then divides it by the number of units produced. That gives a clean per-unit cost.
The second relationship is useful in economics classes and tables. If you already know average total cost and average fixed cost, you can subtract them to get AVC. This calculator does not use that route. It uses TVC ÷ Q.
What Each Variable Means
Each value in this formula connects directly to your calculator inputs. These are not abstract terms. They represent real production data.
AVC (Average Variable Cost)
This is the final result. It shows the average variable cost for one unit of output. Users usually read it as the direct cost per item before fixed overhead is added.
TVC (Total Variable Cost)
This means total variable costs. It includes costs that rise when output rises, such as materials, hourly labor, packaging, or fuel tied to production volume.
Q (Total Quantity)
This means quantity of output. It is the total number of units produced in the same period as the variable costs. The calculator divides TVC by this number.
ATC (Average Total Cost)
This means average total cost. It includes both fixed and variable cost per unit. Many users search AVC and ATC together, so this term matters for comparison.
AFC (Average Fixed Cost)
This means average fixed cost. It is the fixed cost per unit. In economics, AVC and AFC together make up average total cost. That is why the shortcut AVC = ATC – AFC appears in many learning resources.
Another Example Calculation (Step-by-Step)
Let’s walk through a fresh example using real numbers.
Given:
- Total Variable Costs (TVC): 7,200
- Total Quantity (Units): 1200 Units
Calculation:
					AVC = TVC / Q
AVC = 7,200 / 1,200
AVC = $6.00
Result:
- Average Variable Cost = $6.00 per unit
Meaning:
This result shows each unit carries $6 in variable cost. If the market price stays above $6, the firm can usually keep covering direct production costs in the short run. If price falls below that point, shutdown risk increases. Economics sources consistently connect AVC to this short-run decision line.
What is average variable cost(AVC)?
Average variable cost is the variable expense tied to one unit of output. It shows how much each item costs in materials, hourly labor, fuel, packaging, or other costs that rise only when production rises. Economics sources and forum discussions also link AVC to the short-run shutdown rule, which is why users often search it alongside price, ATC, and marginal cost.
Think of a sandwich shop during lunch rush. Bread, meat, sauce, wrappers, and part-time staff hours all rise when more sandwiches are made. Those are variable costs. Average variable cost asks one simple question. How much of that changing cost belongs to each sandwich?
That matters because AVC is not the same as total variable cost, and it is not the same as average total cost. Reddit and student forums show that people often mix up AVC with ATC, or miss the short-run point completely. Fixed costs like rent still exist, but AVC focuses only on the costs that move with output.
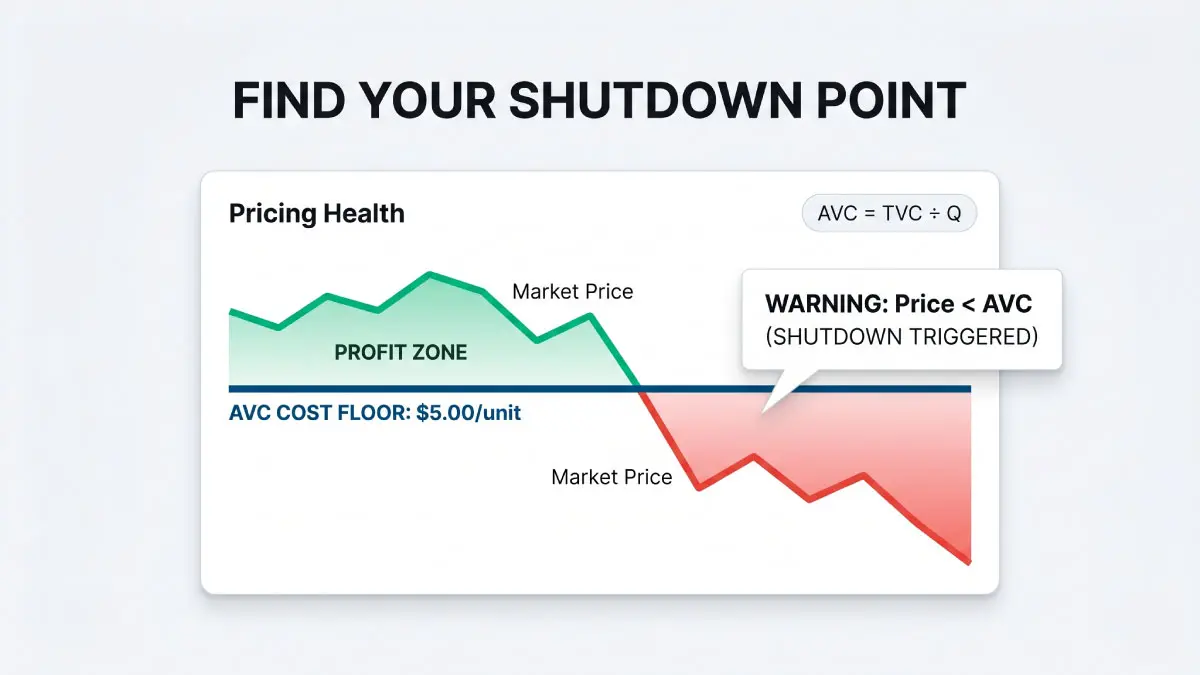
Why this matters
This matters when price gets tight. If your selling price cannot cover your average variable cost, each extra unit can deepen the short-run loss. That is why AVC helps with pricing, output decisions, and shutdown calls.
Standard Variable Cost Benchmarks
Your average variable cost calculator result only makes sense when you compare it with market price. This section shows where your cost stands and what it means for your business. Focus on the gap between your AVC and selling price. That gap decides profit or loss.
| Market Price vs AVC | Category | Market Condition | Business Impact | Action Guide |
|---|---|---|---|---|
| Price well above AVC | Comfortable Margin | Variable costs are easily covered. | Generates cash for fixed overhead. | Safe to scale operations. |
| Price close to AVC | Pressure Zone | Pricing margin is dangerously thin. | Leaves little room for errors. | Renegotiate supplier material costs. |
| Price equals AVC | Break-Even Point | Firm covers direct bills only. | Zero cash left for office rent. | Raise prices or pause expansion. |
| Price below AVC | Shutdown Risk | Cash bleeds on every single sale. | Worsens short-run company losses. | Halt production immediately. |
| Falling AVC as output rises | Scale Benefit | Workers and workflows get faster. | Per-unit efficiency is improving. | Continue increasing production volume. |
| Rising AVC as output rises | Cost Pressure | Diminishing returns hit the factory. | Overtime wages eat your profit. | Stop pushing capacity limits. |
Heads-up: Focus on the gap between your selling price and AVC. That gap drives short-run profit or loss decisions.
Interpretation
Your result is not about hitting a fixed number. It is about where your cost sits compared to your selling price. A wide gap gives safety. A narrow gap creates pressure. If cost crosses price, losses grow fast. That is the point where tough decisions begin
Pro Tip
Track your AVC trend over time, not just one result. A rising cost trend is an early warning. Fix it before your margins disappear.
Why is the average variable cost curve U-shaped?
Average variable cost falls at first, then rises as output grows. Early production improves efficiency, so cost per unit drops. After a point, limits hit. Workers slow down, machines get crowded, and each extra unit costs more. That creates the U-shape.
At low output, resources are underused. One worker can handle more tasks. Machines sit idle part of the time. As production increases, these resources get used better. Costs spread across more units. The average variable cost moves down.
At higher output, pressure builds. Workers rush. Mistakes increase. Machines run close to full capacity. Extra units need more time or effort. This is where diminishing returns begin. Cost per unit starts to climb again.
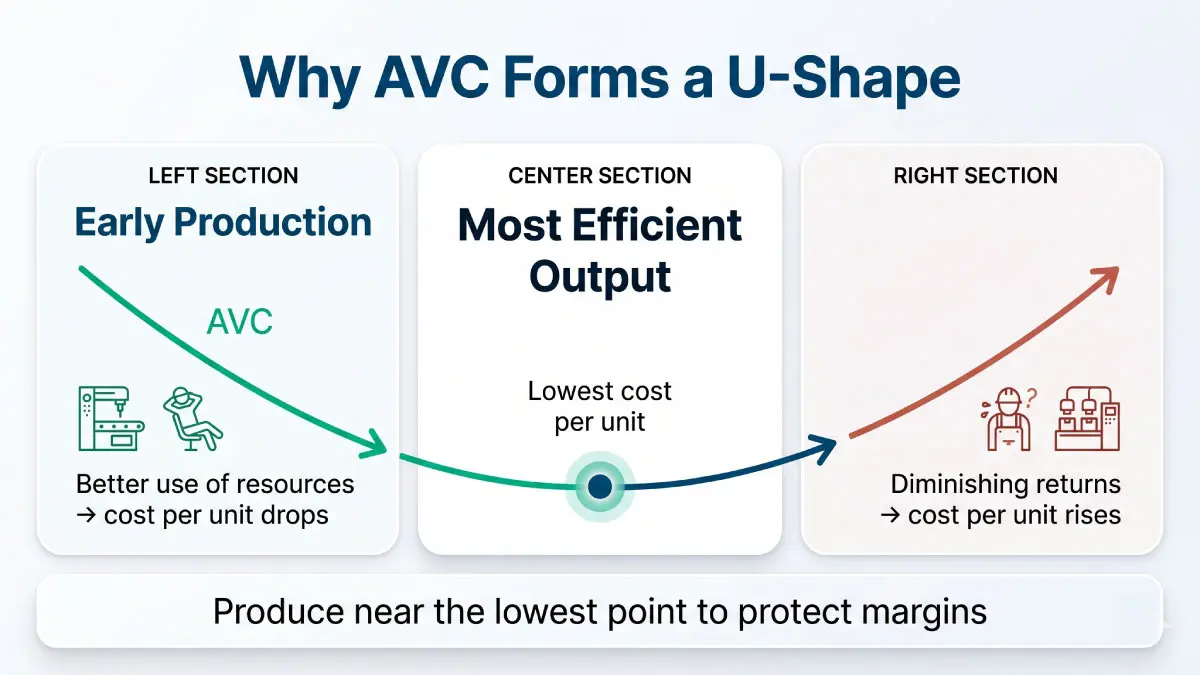
What this means for your decision
The lowest point of the curve is your most efficient level. That is where cost per unit is at its minimum. Producing near that level helps protect margins. Pushing beyond it can raise your cost and increase risk if prices stay tight.
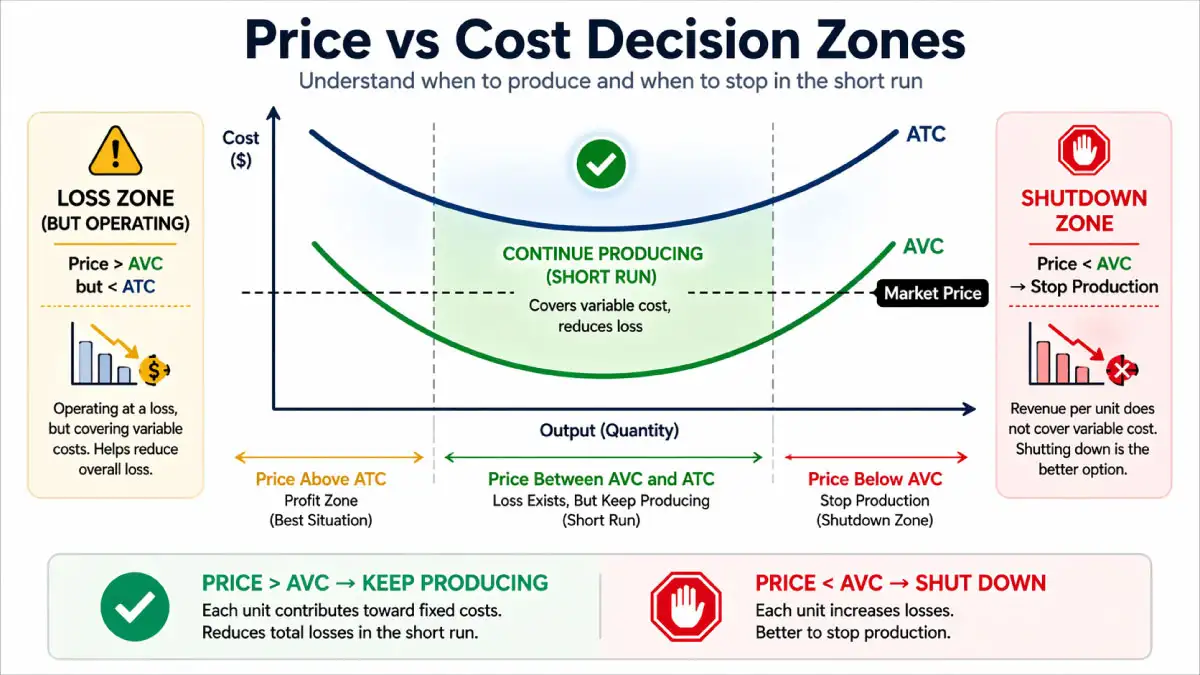
What if price is below ATC but above AVC?
This situation means the business is not covering total costs, but it is still covering variable costs. In the short run, production can continue because each unit still pays for materials and labor, even if fixed costs like rent are not fully covered.
What this actually means
When price sits above AVC but below ATC, the business is operating at a loss overall. Fixed costs are not fully recovered. Still, stopping production would be worse because revenue would drop to zero while fixed costs remain. Continuing production helps recover part of those fixed costs.
Why firms keep producing in this zone
Shutting down removes all revenue. Fixed costs still exist. That makes the loss larger. Operating in this range reduces losses instead of increasing them. Each unit sold still contributes something toward fixed expenses.
When this becomes a problem
This is only a short-run strategy. If price stays below ATC for too long, the business cannot survive. Over time, firms must either:
- raise prices
- lower costs
- or exit the market
Simple rule to remember
Price > AVC → keep producing (short run)
Price < AVC → stop productionPrice < ATC → loss exists, but decision depends on AVC
What to Do After Using the Average Variable Cost Calculator
Your result is not the finish line. It is your decision trigger. Most users get stuck here. They see the number but do not know what to change next. This section fixes that. Your next move depends on how your AVC compares with market price and how it behaves as output changes.
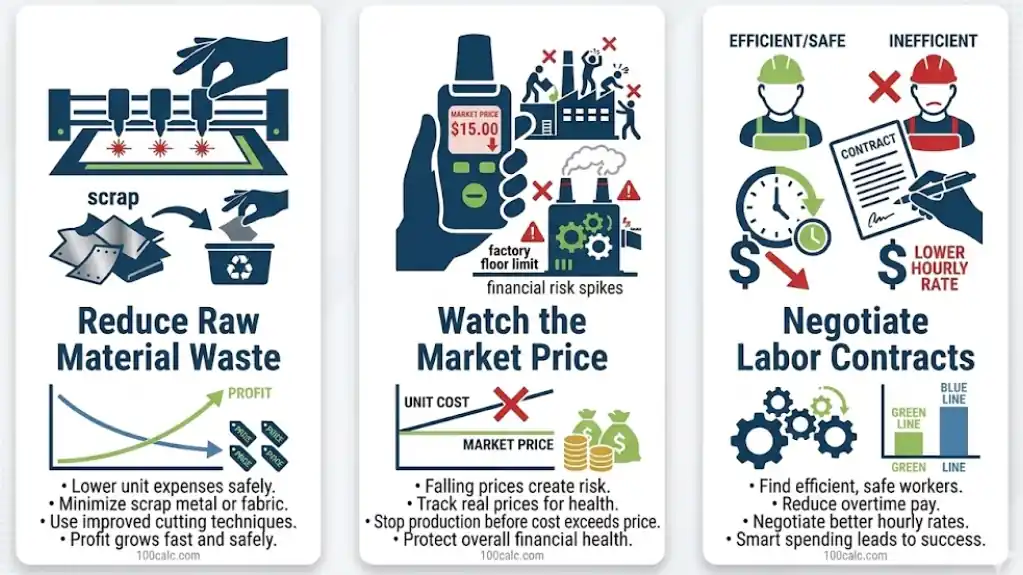
Reduce Raw Material Waste
If your cost is high, train your factory workers to cut materials more efficiently or switch to a supplier with fewer defective parts. Every ounce of saved material drops your direct cost instantly.
Watch the Market Price
If your direct expenses sit dangerously close to your final selling point, watch the market closely. If competitors force the retail price below your current cost floor, halt operations until you secure cheaper supplies.
Negotiate Labor Contracts
If you have a comfortable margin, use this strong position to negotiate labor contracts before scaling up. Secure favorable hourly rates to prevent expensive overtime wages from ruining your future margins.
You Might Also Find These Helpful
Economics 6
No tools published here yet.
Related Tools People Use Next
Common Mistakes When Using the Average Variable Cost Calculator
Small input mistakes can completely change your result. Many users confuse cost types or enter mismatched values from different periods. These errors lead to wrong pricing decisions and poor output planning. Fixing these early keeps your average variable cost accurate and useful.
- Entering total cost instead of variable cost only
- Using quantity from a different time period than costs
- Including fixed costs like rent or salaries in TVC
- Entering zero or very low quantity, which breaks the calculation
- Assuming the market selector converts currency instead of just changing the symbol
Frequently Asked Questions (FAQs)
How do I find TVC?
TVC means total variable cost. Add up costs that rise when output rises, such as raw materials, hourly labor, packaging, utilities tied to production, shipping, or fuel. Fixed bills like rent do not belong here.
What does AVC mean in economics?
AVC means average variable cost. It shows the variable cost attached to one unit of output. This helps firms judge cost pressure, compare price against direct cost, and think through short-run production choices.
How do you calculate AVC, ATC, and MC?
Use AVC = TVC ÷ Q. Use ATC = TC ÷ Q. Use MC = change in total cost ÷ change in output. These three are often taught together because they explain different sides of per-unit and extra-unit cost.
Why does marginal cost cross AVC at its lowest point?
When marginal cost is below AVC, it pulls the average down. When marginal cost rises above AVC, it pushes the average up. That is why the MC curve crosses AVC at AVC’s minimum point.
How do you find average variable cost from a table?
Pick one output row. Take the total variable cost for that row and divide it by quantity. That gives AVC for that output level. This is one of the most common student questions in economics tables and homework sets.
Is AVC the shutdown point?
Not by itself. In the short run, firms compare market price with AVC. If price falls below AVC, production usually stops because each added unit fails to cover variable cost.
What is the difference between AVC and average total cost?
AVC uses only variable costs. Average total cost includes both fixed and variable costs. That is why ATC is always above AVC unless fixed cost becomes negligible at very high output.
Does average variable cost include salaries?
Usually, no for salaried managers and office staff, because those are treated as fixed costs in the short run. Hourly production wages are more likely to count as variable cost because they change with output.
How do I find AVC from total cost and fixed cost?
Start with Variable Cost = Total Cost – Fixed Cost. Then divide that variable cost by quantity. This is useful when a table gives total cost and fixed cost but does not show TVC directly.
What is the difference between marginal cost and average variable cost?
Marginal cost is the cost of making one more unit. Average variable cost is the average variable cost across all units produced. That is why the two are related but not interchangeable.
Questions?
We had love to hear from you! Whether you are reporting an issue, suggesting a new calculator, or exploring collaboration opportunities — we are here to help. Every message helps us make 100calc smarter, faster, and more helpful for everyone.
Why People Trust 100calc
At 100calc.com, we focus on accuracy, speed, and trust. Every calculator we create is designed to give reliable, instant, and easy-to-understand results you can truly depend on.