High Low Method Calculator for Quick Cost Analysis
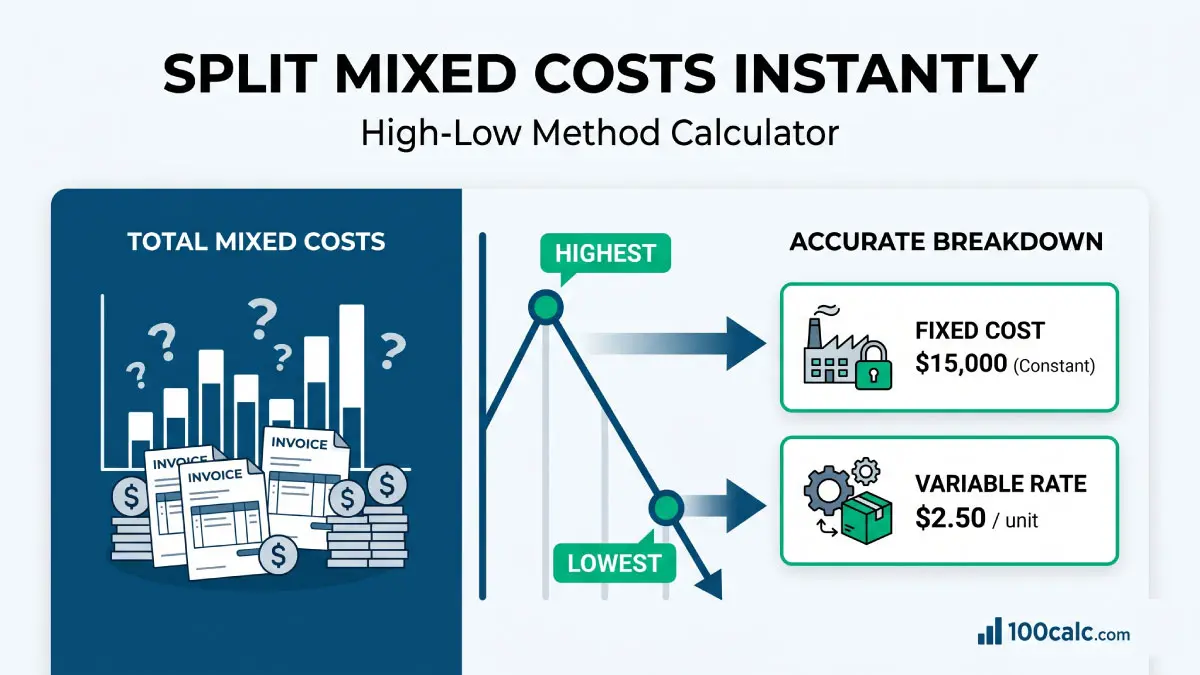
A High Low Method Calculator helps you split a mixed cost into variable cost per unit and fixed cost using the highest and lowest activity levels. You can also enter a new activity level to estimate total cost and see how much of that total comes from fixed cost.
Mixed costs can get confusing fast. One month looks expensive. Another looks efficient. So what is really changing per unit, and what stays the same no matter what? That is the gap this tool solves.
Enter your high and low cost data, then get a fast answer you can use for cost accounting, budgeting, pricing, and forecasting. This page also explains the high low method formula, shows how fixed cost is found, and helps you read the result in a practical way.
Quick Facts
- Finds variable cost per unit
- Finds fixed cost
- Predicts total cost at a new activity level
- Shows fixed cost as a share of projected total cost
- Uses the classic y = a + bx cost model
- Updated Jun 16, 2026
- Reviewed by 100Calc Research Team
Use the High Low Method Calculator
Enter your highest and lowest cost points along with their activity levels. Then add a new activity level if you want to predict total cost. This high low method calculator will quickly show your variable cost per unit, fixed cost, and an estimated total for planning. Add your values below and get instant results.
Calculate Fixed and Variable Costs from Mixed Activity Levels
VARIABLE COST
FIXED COST
--
Explore More Calculators
Calculate price elasticity of demand instantly using the midpoint formula. Get accurate PED score, revenue impact, and real examples in seconds.
Try calculatorFind your true cost per unit in seconds. This Average Variable Cost Calculator shows your pricing floor and warns when each sale starts losing…
Try calculatorUse the Comparative Advantage Calculator to compare opportunity costs, find who should specialize, and avoid the table mistakes that flip answers.
Try calculatorUse this cross price elasticity calculator to see if products are substitutes or complements. Get instant results, % changes, and clear market insights in…
Try calculatorUse this marginal cost function calculator to find cost per unit instantly. Enter change in cost and output to make smarter pricing decisions fast.
Try calculatorUse this marginal revenue calculator to find profit per unit fast. Compare cost, revenue, and output to make smarter pricing decisions instantly.
Try calculatorExplore Related Tools
What is the High Low Method in cost accounting?
The high low method is a simple way to split a mixed cost into variable cost per unit and fixed cost using only two data points. It looks at the highest and lowest activity levels, then estimates how cost behaves as activity changes.
In real life, many costs are not fully fixed or fully variable. For example, a delivery business may see total cost rise as orders increase, but part of that cost stays the same each month. The high low method helps break that total into two parts so you can understand what actually changes.
Imagine a small printing shop. In one busy month, it prints 8,000 flyers and spends $28,000. In a slower month, it prints 3,000 flyers and spends $20,000. Instead of guessing, the business uses these two points to see how much each extra flyer adds to cost, and what portion stays steady.
This method is popular because it is fast and easy to use. However, it only uses two points, so it gives an estimate, not a perfect answer. It works best when those high and low points are normal and not unusual spikes.
Micro Insight:
This matters because once you understand your cost behavior, you can make smarter decisions about pricing, output, and growth. A simple estimate is often enough to spot problems early and adjust before costs get out of control.
What Your High Low Method Result Means
Your results show how your total cost behaves as activity changes. The variable cost per unit tells you how much cost increases for each extra unit. The fixed cost shows what stays the same within your current range. If you added a new activity level, the total predicted cost shows what you might spend at that level.
Understanding Your Result
The variable cost per unit is your “per unit driver.” If it is $5, every new unit adds about $5 to your total cost. This helps you understand how cost grows with activity. Fixed cost is your base cost. It does not change with each unit in this range. This includes things like rent, salaries, or equipment costs.
When you enter a new activity level, the calculator combines both parts. It gives you a total cost estimate based on the same pattern. This is useful for quick budgeting and planning.
Is Your Result Good or Bad?
There is no single “good” number here. It depends on your business and pricing. A low variable cost per unit usually means you can scale more easily. Each extra unit adds less cost.
A high variable cost per unit means costs rise quickly with activity. Margins can get tight if pricing is low. A high fixed cost means you need more output to spread that cost. At low activity, fixed cost can feel heavy.
A low fixed cost gives more flexibility, especially when demand drops. Look at your predicted total. If fixed cost takes a large share at your current output, it may signal that volume is too low.
What You Should Do Next
- Check if your selling price covers the variable cost per unit with room for profit
- Compare your fixed cost with your expected output to see if you need more volume
- Test different activity levels to see how total cost changes
- If the numbers feel off, review your high and low data points before making decisions

Example Interpretation:
Let’s test a new case.
- Highest Cost: $40,000 at 8,000 units
- Lowest Cost: $25,000 at 4,000 units
Result:
- Variable Cost = $3.75 per unit
- Fixed Cost = $10,000
Meaning:
Each new unit adds about $3.75 to your cost. Even with no activity, you still carry $10,000 in fixed cost. If your selling price is close to $3.75, profit will be tight. You may need higher pricing or more volume to spread that fixed cost better.
How the High Low Method Calculator Works
This tool follows a simple process behind the scenes. It compares two activity points, then breaks your total cost into variable and fixed parts. Each step below shows what happens when you enter your data.
Choose your region and currency display
Start by selecting your region. This only changes the currency symbol and label. The calculation stays the same. It helps you read results in a familiar format based on your location.
Enter the highest cost and activity level
Add your highest total cost and the number of units linked to it. The calculator uses this as the top point. This value plays a key role when it later separates fixed cost from total cost.
Enter the lowest cost and activity level
Now add your lowest total cost and its activity level. The tool compares this point with the high point. It looks at how much cost and activity changed between these two values.
Click Analyze Costs to break the cost pattern
Once you click the button, the calculator finds the difference in cost and activity. It divides both to get the variable cost per unit. Then it removes this variable part from the high point to reveal the fixed cost.
Add a new activity level to estimate total cost
If you enter a new activity level, the tool multiplies it by the variable cost. Then it adds fixed cost. This gives you a predicted total. It also shows what share of that total is fixed cost.
Example for testing
Try this set of values:
- Highest Cost: $60,000 at 12,000 units
- Lowest Cost: $30,000 at 6,000 units
- New Activity: 9,000 units
Result:
Variable Cost = $5.00 per unit
Fixed Cost = $0
Total Predicted = $45,000This happens because the cost rises evenly with activity. No constant cost remains in this case.
How the High Low Method Formula Works (Complete Breakdown)
The High Low Method Calculator uses a simple cost accounting formula to split mixed cost into two parts. One part changes with activity. The other stays steady within the same range. Once those two pieces are clear, the tool can also estimate total cost at a new activity level. The formula below matches the standard high-low method used in accounting references and common calculator tools.
Standard High-Low Equation
Formula:
Variable Cost per Unit
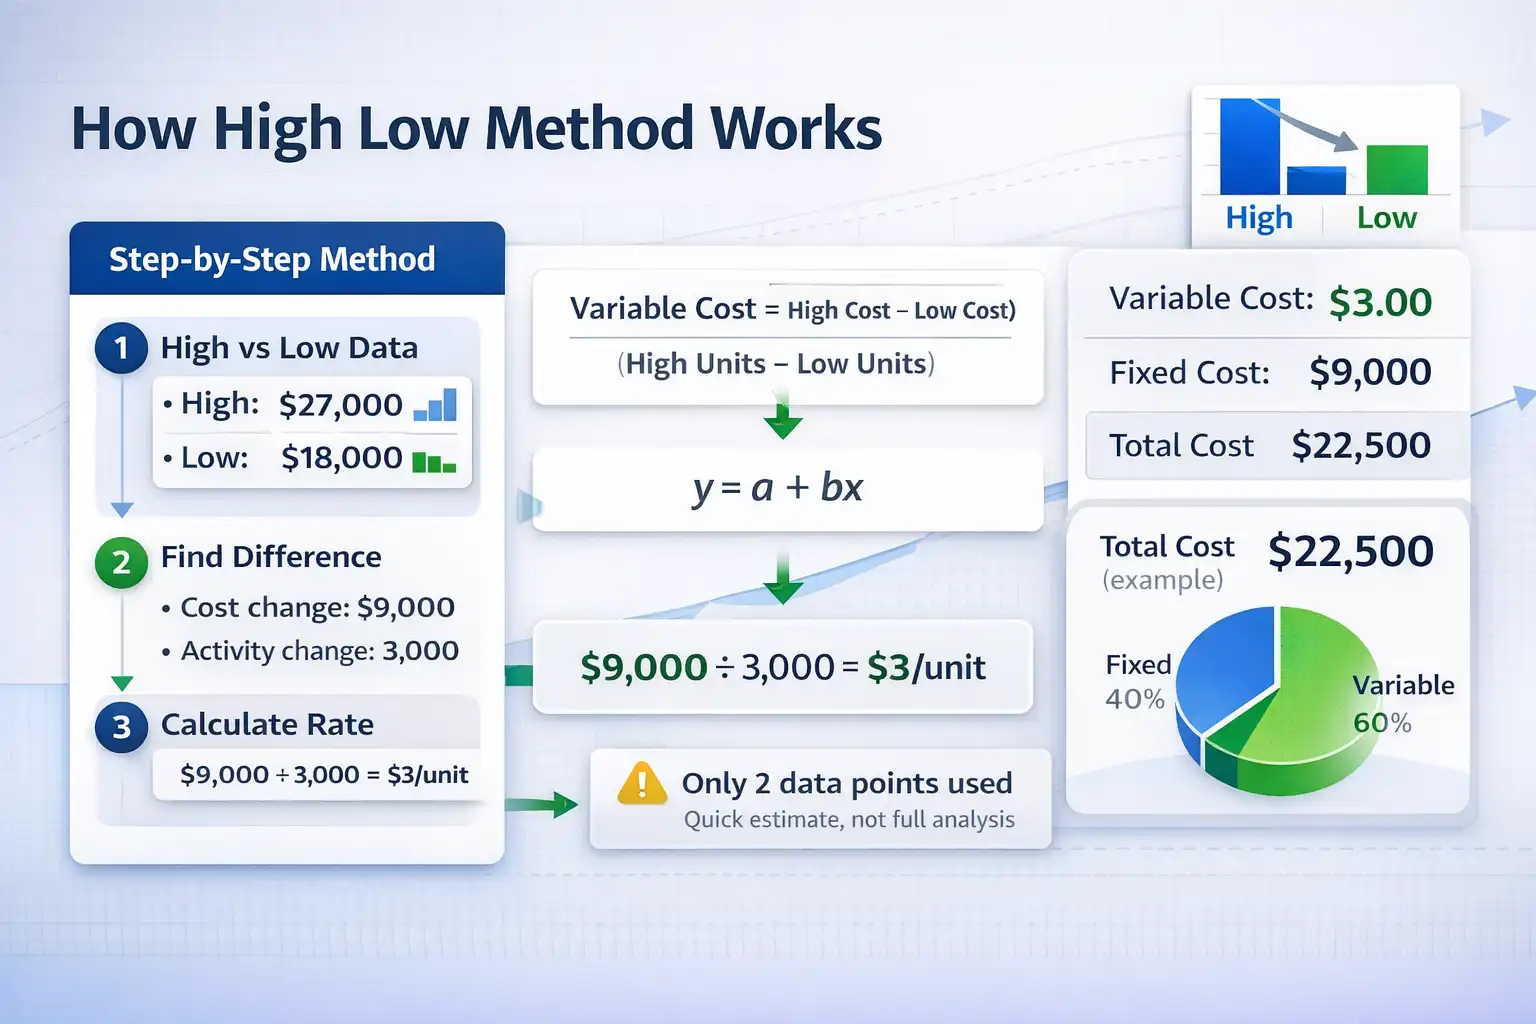
Variable Cost per Unit = (Highest Total Cost - Lowest Total Cost) / (Highest Activity - Lowest Activity)
Fixed Cost
Fixed Cost = Highest Total Cost - (Variable Cost per Unit × Highest Activity)
Cost Equation
y = a + bx
Predicted Total Cost
Total Predicted = Fixed Cost + (Variable Cost per Unit × New Activity Level)
What This Formula Does
This formula shows how cost changes as activity rises or falls. First, it finds the cost added by each extra unit. Then it removes that changing part from the high point to reveal the fixed cost.
The y = a + bx equation is the simple cost model behind the result. In that model, y is total cost, a is fixed cost, b is variable cost per unit, and x is the activity level. The standard method uses the highest and lowest activity levels, not just the highest and lowest costs.
What Each Variable Means
This formula shows how cost changes as activity rises or falls. First, it finds the cost added by each extra unit. Then it removes that changing part from the high point to reveal the fixed cost.
The y = a + bx equation is the simple cost model behind the result. In that model, y is total cost, a is fixed cost, b is variable cost per unit, and x is the activity level. The standard method uses the highest and lowest activity levels, not just the highest and lowest costs.
Highest Total Cost
This is the full cost recorded at the busiest activity point in your data. It gives the calculator the top cost value linked to the highest unit level, which is needed to split mixed cost the right way.
Lowest Total Cost
This is the full cost recorded at the lowest activity point. The calculator compares it with the highest total cost to find how much total cost changed across the two activity levels.
Highest Activity
This is the largest number of units, hours, jobs, or output used in the method. It tells the tool which point counts as the high activity level for the high-low calculation.
Lowest Activity
This is the smallest number of units, hours, jobs, or output used in the method. It gives the low activity point that the calculator compares against the high point to measure change.
Variable Cost per Unit
This result shows how much cost increases for each extra unit of activity. It acts like the slope of the cost line, which is how standard accounting sources describe the variable rate in this method.
Fixed Cost
This is the cost that stays in place within the activity range used. After the calculator removes the variable part from total cost, the amount left is treated as the fixed portion.
New Activity Level
This is the optional unit level used for projection. When you enter it, the calculator applies the same fixed cost and variable cost pattern to estimate a new total cost.
Another Example Calculation (Step-by-Step)
Let’s use a fresh set of values you can test in the calculator.
Given:
- Highest Total Cost = $48,000
- Highest Activity = 9,000 units
- Lowest Total Cost = $30,000
- Lowest Activity = 4,500 units
- New Activity Level = 7,200 units
Calculation:
					Variable Cost per Unit = (48,000 - 30,000) / (9,000 - 4,500)
Variable Cost per Unit = 18,000 / 4,500
Variable Cost per Unit = $4.00

Fixed Cost = 48,000 - ($4.00 × 9,000)
Fixed Cost = 48,000 - 36,000
Fixed Cost = $12,000

Total Predicted = 12,000 + ($4.00 × 7,200)
Total Predicted = 12,000 + 28,800
Total Predicted = $40,800
Result:
- Variable Cost per Unit = $4.00
- Fixed Cost = $12,000
- Total Predicted Cost = $40,800
Meaning:
This result shows that each extra unit adds $4 to total cost. It also shows that $12,000 stays constant in this activity range. At 7,200 units, the calculator projects a total cost of $40,800 using that same cost pattern. This follows the same high-low method flow used in standard accounting guidance and online tools.
High Low Method Calculator Result Benchmarks Explained
Your high low method calculation result is not just a number. It shows how your cost behaves as activity changes. These benchmarks help you see if your cost structure is flexible, balanced, or heavy on fixed cost so you can plan pricing, output, and growth more confidently.
| Range | Label | USA Guideline | India Guideline | Notes |
|---|---|---|---|---|
| Fixed % below 30% | Variable-Heavy | Costs move mostly with output. Flexible for small businesses and startups. | Common in service and small-scale operations. | Good for scaling. Watch margins if variable cost is high. |
| Fixed % 30%–60% | Balanced | Mix of fixed and variable costs. Stable and predictable. | Seen in growing firms with moderate overhead. | Healthy structure. Focus on improving efficiency. |
| Fixed % above 60% | Fixed-Heavy | High overhead. Profit depends on higher volume. | Common in manufacturing or asset-heavy businesses. | Low output can increase cost pressure quickly. |
| Low Variable Cost per Unit | Efficient | Lower cost added per unit. Better scaling potential. | Preferred in competitive pricing markets. | Supports higher profit if demand grows. |
| High Variable Cost per Unit | Costly | Each unit adds significant cost. Tight margins likely. | Common in labor-intensive or material-heavy work. | Pricing and cost control become critical. |
Heads-up: These ranges are general guides. Your result depends on your industry, pricing, and activity level. Always compare with your own business data.
Interpretation
A lower fixed percentage means your costs adjust easily with demand. A higher fixed percentage means you need steady or higher output to stay efficient. Variable cost per unit tells you how much each unit affects total cost, which directly impacts your pricing decisions.
Pro Tip:
If your fixed cost percentage is high, try increasing output or spreading overhead across more units. If your variable cost per unit is high, review suppliers or processes to reduce per-unit cost and protect your margins.
How do you calculate the high low method?
To calculate the high low method, use the highest and lowest activity levels in your data, not just the highest and lowest costs. Find the change in total cost, divide it by the change in activity to get variable cost per unit, then use that rate to work out fixed cost. This method is widely used to split mixed costs into fixed and variable parts for planning and budgeting.
What is the high low method for a small bakery?
A small bakery wants to understand how packaging and overhead costs behave as production changes.
Use these inputs in the calculator:
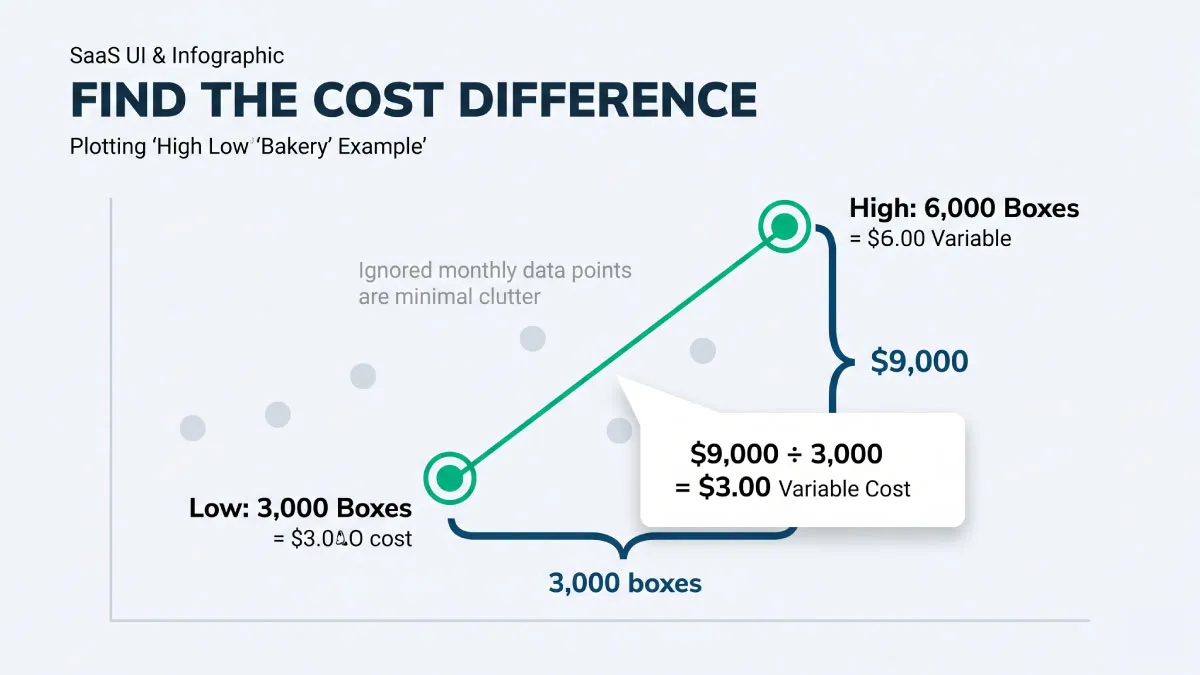
- Highest Total Cost = $27,000
- Highest Activity = 6,000 boxes
- Lowest Total Cost = $18,000
- Lowest Activity = 3,000 boxes
- Predict for New Activity Level = 4,500 boxes
Process:
- The cost difference is $9,000.
- The activity difference is 3,000 boxes.
- Variable cost per box = $9,000 ÷ 3,000 = $3.00
- Fixed cost = $27,000 – ($3.00 × 6,000) = $9,000
- Variable total at 4,500 boxes = $3.00 × 4,500 = $13,500
- Total predicted cost = $13,500 + $9,000 = $22,500
- Fixed cost % = ($9,000 ÷ $22,500) × 100 = 40.0%
Final result:
- Variable Cost per Unit = $3.00
- Fixed Cost = $9,000
- Total Predicted Cost = $22,500
- Var. Total = $13,500
- Fixed % = 40.0%
Meaning
Each extra box adds about $3 in cost. The bakery also carries $9,000 in steady cost before production begins.
How can a delivery business use the high low method?
A local delivery company wants a fast way to estimate cost at a new order volume.
Use these inputs in the calculator:
- Highest Total Cost = $41,000
- Highest Activity = 8,000 deliveries
- Lowest Total Cost = $29,000
- Lowest Activity = 5,000 deliveries
- Predict for New Activity Level = 6,200 deliveries
Expected output:
- The cost difference is $12,000.
- The activity difference is 3,000 deliveries.
- Variable cost per delivery = $12,000 ÷ 3,000 = $4.00
- Fixed cost = $41,000 – ($4.00 × 8,000) = $9,000
- Variable total at 6,200 deliveries = $4.00 × 6,200 = $24,800
- Total predicted cost = $24,800 + $9,000 = $33,800
- Fixed cost % = ($9,000 ÷ $33,800) × 100 = 26.6%
Final result:
- Variable Cost per Unit = $4.00
- Fixed Cost = $9,000
- Total Predicted Cost = $33,800
- Var. Total = $24,800
- Fixed % = 26.6%
Meaning
This business adds about $4 for each extra delivery. Since fixed cost takes a smaller share here, total cost moves more with activity.
What is a high low method example for a service company?
A cleaning service wants to estimate total monthly cost before taking on more client visits.
Use these inputs in the calculator:
- Highest Total Cost = £22,500
- Highest Activity = 4,500 visits
- Lowest Total Cost = £15,300
- Lowest Activity = 2,100 visits
- Predict for New Activity Level = 3,000 visits
Process:
- The cost difference is £7,200.
- The activity difference is 2,400 visits.
- Variable cost per visit = £7,200 ÷ 2,400 = £3.00
- Fixed cost = £22,500 – (£3.00 × 4,500) = £9,000
- Variable total at 3,000 visits = £3.00 × 3,000 = £9,000
- Total predicted cost = £9,000 + £9,000 = £18,000
- Fixed cost % = (£9,000 ÷ £18,000) × 100 = 50.0%
Final result:
- Variable Cost per Unit = £3.00
- Fixed Cost = £9,000
- Total Predicted Cost = £18,000
- Var. Total = £9,000
- Fixed % = 50.0%
Meaning
Half of the projected total cost is fixed in this case. That tells the business output matters because more visits can spread overhead better.
Quick rules to remember
The high low method calculator works best when your high and low points reflect normal business activity, because the method only uses two data points and can be distorted by unusual extremes. It is most useful for quick estimates, budget planning, and short-term cost forecasting when you need a fast answer before doing deeper analysis.
Which currency or region should you select?
Pick the region that matches how you want the result to appear on screen. In this High Low Method Calculator, the region changes the currency symbol and region label only. It does not convert values, change the formula, or apply a different accounting rule. Current high-low method tools generally keep the method itself the same across regions, even when display options differ.
| Region | Currency Display | Best For | Formula Changes? | Notes |
|---|---|---|---|---|
| United States | USD ($) | USA users, accounting students, business owners | No | Shows dollar format only. High-low method stays the same. |
| United Kingdom | GBP (£) | UK learners, finance teams, classroom use | No | Useful for pound-based examples and reporting. |
| India | INR (₹) | India users, commerce students, local practice | No | Only the symbol changes. Inputs stay exactly as entered. |
| Pakistan | PKR (Rs.) | Pakistan users, local accounting and study use | No | Best when you want rupee-based result labels. |
| Eurozone | EUR (€) | EU users, training, business planning | No | Formula and output logic remain identical. |
| UAE / Saudi Arabia | Dh / SR | Gulf users, regional teams, study support | No | Choose the label that matches your reporting style. |
Heads-up: The high-low method stays the same in every region. Only the displayed currency symbol and region label change.
Optional Note: Use the region that matches your report, worksheet, or classroom format. The math does not change across countries because the high-low method uses the same cost behavior logic everywhere.
What to Do After Using the High Low Method Calculator (Expert Tips)
Your result from the high low method calculator gives you a quick cost snapshot. Now comes the real part. Turning those numbers into better pricing, planning, and decisions. Small changes in cost structure can shift profit fast, so acting on these insights matters more than the calculation itself.
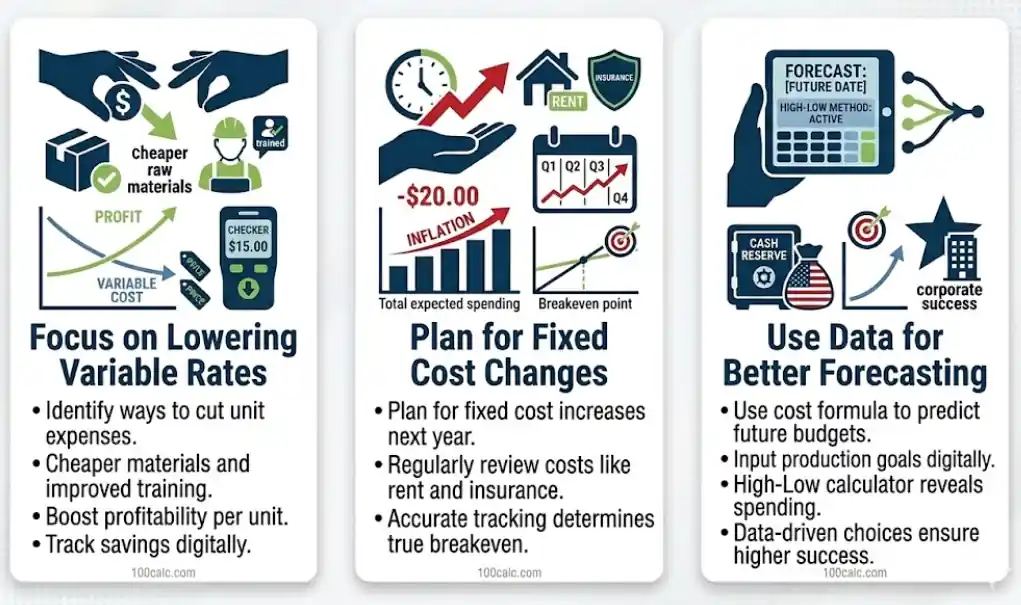
Focus on Lowering Variable Rates
Look closely at your variable cost per unit. If this number feels high, your cost rises too fast with each unit. That can hurt margins. Try reviewing suppliers, reducing waste, or improving process efficiency. Even a small drop per unit can improve total profit when volume increases.
Plan for Fixed Cost Changes
Your fixed cost tells you how much pressure your business carries before selling anything. If this number is high, you need more output to stay efficient. Think about spreading overhead across more units or reducing unused expenses. Better planning here can stabilize your cost structure.
Use Data for Better Forecasting
The high-low method is a fast estimate, not a final answer. Use it as a starting point. Then compare with more data over time. Track different activity levels and costs. This helps you spot patterns and build more accurate forecasts for pricing, budgeting, and growth decisions.
You Might Also Find These Helpful
Economics 6
No tools published here yet.
Related Tools People Use Next
Common Mistakes When Using the High Low Method Calculator
Many users get incorrect results not because of the calculator, but due to small input errors or wrong assumptions. The high low method looks simple, yet it depends on clean data and correct points. Avoid these common mistakes to get accurate cost estimates.
- Choosing highest and lowest costs instead of highest and lowest activity levels
- Mixing different currencies or units in the same calculation
- Thinking the region selector converts values instead of only changing symbols
- Using unusual or one-time spikes as high or low data points
- Treating the result as exact instead of a quick estimate based on two points
Frequently Asked Questions (FAQs)
What is the high low method formula?
The main formula is: Variable Cost per Unit = (Highest Cost − Lowest Cost) ÷ (Highest Activity − Lowest Activity). After that, Fixed Cost = Total Cost − (Variable Cost × Activity Level). This is the standard high-low method used in cost accounting to split mixed costs.
It is also often shown as y = a + bx, where total cost equals fixed cost plus variable cost per unit times activity. The main formula finds your variable cost per unit. You subtract the lowest cost from the highest cost, then divide by the highest units minus the lowest units.
After that, calculate the fixed cost by subtracting the total variable expenses from the total cost. These equations build your final cost model.
How do you calculate fixed cost using the high-low method?
First find the variable cost per unit. Next multiply that rate by either the high activity or low activity units. Then subtract that variable amount from the matching total cost. The amount left is the fixed cost for that activity range. You can use either the high point or low point after finding the variable rate. Both should give the same fixed cost if the data is consistent.
Why use the high-low method in accounting?
The high-low method is popular because it is quick, simple, and useful when you have limited data. It helps estimate fixed and variable cost behavior for budgeting, forecasting, pricing, and short-term planning without using more advanced analysis. It is best for fast estimates, not high-stakes decisions that need deeper cost modeling.
What is the biggest weakness of the high-low method?
Its biggest weakness is that it uses only two data points. If either point is unusual, seasonal, or distorted by a one-time event, the result can mislead you and give a poor estimate of normal cost behavior. That is why many accounting sources treat it as a rough method and suggest checking results against broader data when accuracy matters.
What does y = a + bx mean in the high-low method?
This is the cost equation behind the method. y is total cost, a is fixed cost, b is variable cost per unit, and x is the activity level. It shows how total cost changes as activity rises or falls. Once you know a and b, you can estimate total cost at a new activity level.
Can I use the high-low method in Excel?
Yes. Many students and finance teams set up the same formula in Excel by linking high cost, low cost, high units, and low units in separate cells. Excel works well when you want a quick calculator or a reusable accounting worksheet. It is still the same math. Excel only changes how you enter and reuse the inputs.
Is the high-low method used in ACCA or cost accounting exams?
Yes. The high-low method is a standard managerial and cost accounting topic and is commonly taught in exam-focused learning materials and classroom problems. It is often used to test mixed cost analysis, fixed cost, and variable cost per unit. That is why many users search for worked examples, fixed cost steps, and exam-style questions.
Do you use the highest and lowest cost or the highest and lowest activity?
You should use the highest and lowest activity levels, then take the total cost attached to those two activity points. This is one of the most common areas of confusion, and it is where many homework and exam mistakes begin. If you pick extreme costs without checking activity, you can end up with the wrong variable rate and fixed cost.
Can the high-low method give a negative fixed cost?
Yes, it can. A negative fixed cost usually signals that the data points do not fit a stable linear cost pattern, or that one of the extreme points is abnormal. The math can still produce that answer, but the business meaning may be weak. When that happens, it is smart to review the data range and check whether another method would fit better.
When should you not use the high-low method?
Avoid it when your data has outliers, sharp cost jumps, seasonal swings, or a cost pattern that is not roughly linear. It is also a weak choice when you already have enough data for a better method like regression or a fuller trend review. In short, use it for speed. Do not rely on it when the decision is expensive or hard to reverse.
Is the high-low method the same as average variable cost?
No. The high-low method estimates variable cost per unit and fixed cost from mixed cost data. Average variable cost is a separate economics measure that looks at variable cost divided by output for a period or output level. The two ideas are related, but they are not the same calculation and should not be swapped.
Does the region or currency option change the calculation?
No. In this calculator, the region option only changes the currency symbol and region label shown with the result. It does not convert exchange rates or apply a different formula. The math stays exactly the same.
Questions?
We had love to hear from you! Whether you are reporting an issue, suggesting a new calculator, or exploring collaboration opportunities — we are here to help. Every message helps us make 100calc smarter, faster, and more helpful for everyone.
Why People Trust 100calc
At 100calc.com, we focus on accuracy, speed, and trust. Every calculator we create is designed to give reliable, instant, and easy-to-understand results you can truly depend on.