Comparative Advantage Calculator: Who Should Specialize?
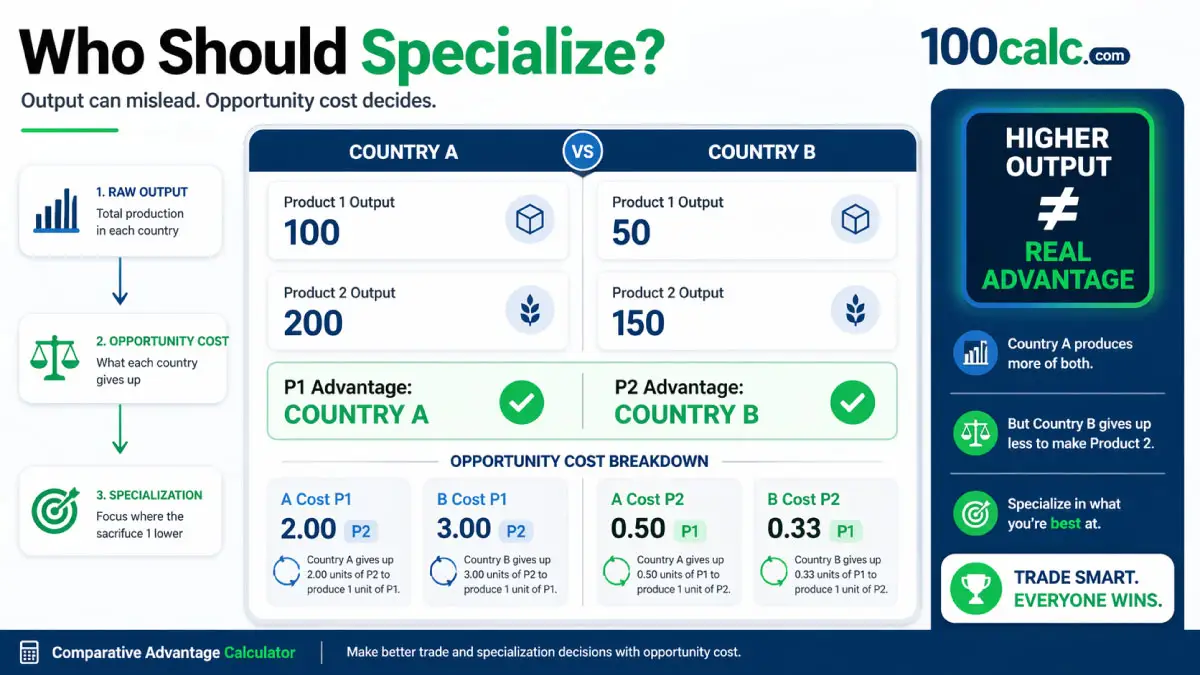
A Comparative Advantage Calculator helps you compare opportunity costs between two countries or producers. It shows who should specialize in each product based on lower sacrifice, not just higher output.
Raw output can be misleading. One side may produce more of both goods and still not have the better trade position. Enter both outputs to see who has the stronger specialization choice for Product 1 and Product 2.
What is a comparative advantage calculator?
A comparative advantage calculator compares opportunity costs between two countries or producers. It shows who should specialize in each product based on lower sacrifice. The side that gives up less of the other good has the comparative advantage. Works for tables, exam questions, and real trade scenarios.
Quick Facts
- Compares 2 countries or entities
- Uses 2 goods
- Based on opportunity cost
- Best for specialization and trade decisions
- Updated May 12, 2026
- Reviewed by 100Calc Research Team
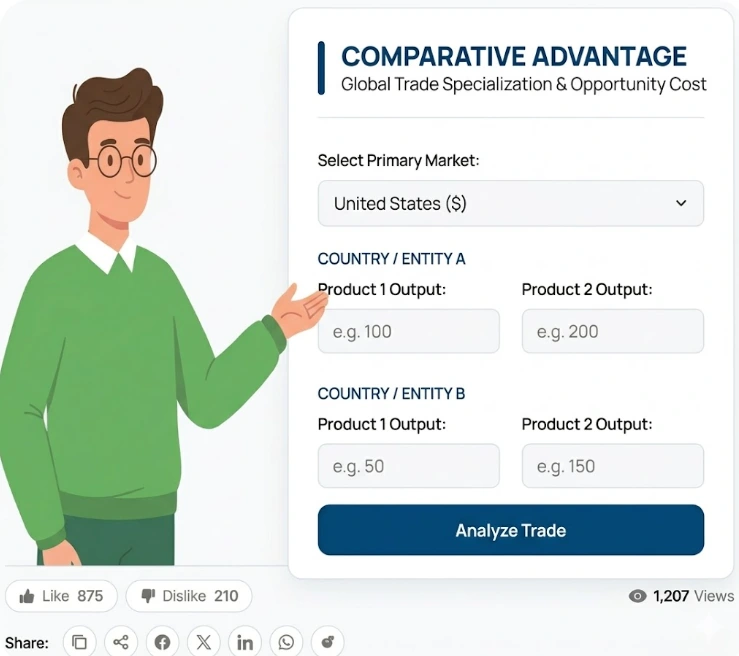
Try the Comparative Advantage Calculator Now
Add the output for Product 1 and Product 2 for both countries or entities. Then click the button to compare opportunity costs and see who should specialize in each product. The result also shows the cost breakdown for both sides, so you can spot the better trade-off fast. Enter your values and get the answer in seconds.
What Your Comparative Advantage Result Means
Your result shows which country or entity gives up less of the other good. That is the real signal of comparative advantage. It tells you where each side should focus production to get better trade outcomes. The result compares trade-offs, not raw output.
Understanding Your Result
Each result compares opportunity cost between two sides. Lower cost wins. If Country A has the advantage in Product 1, it gives up fewer units of Product 2 to produce it. That makes Product 1 its stronger choice.
Is Your Result Good or Bad?
There is no fixed good or bad score here. The result is always relative.
A lower opportunity cost is better. That means stronger efficiency in that product.
A higher opportunity cost is weaker. That product is not the best use of resources.
What You Should Do Next
- Focus production on the product where your side has the advantage
- Trade for the other product instead of producing it
- Double check both products before deciding
- Compare with absolute advantage if needed for class or analysis
A Quick Example to Test
Let’s say two factories make chairs and tables. Enter these values into the calculator above.
Input:
- Country A Output: 300 Chairs, 100 Tables
- Country B Output: 150 Chairs, 150 Tables
The calculator divides these numbers to find the true sacrifice.
Result:
Country A wins chairs. Country B wins tables.
Meaning:
Country A only gives up 0.33 tables to make a chair. Country B gives up a full table to make a chair. Country A should specialize in chairs immediately.
Explore More Calculators
Calculate price elasticity of demand instantly using the midpoint formula. Get accurate PED score, revenue impact, and real examples in seconds.
Try calculatorFind your true cost per unit in seconds. This Average Variable Cost Calculator shows your pricing floor and warns when each sale starts losing…
Try calculatorUse this cross price elasticity calculator to see if products are substitutes or complements. Get instant results, % changes, and clear market insights in…
Try calculatorUse this High Low Method Calculator to find variable cost per unit, fixed cost, and projected total cost fast for budgeting, pricing, and planning.
Try calculatorUse this marginal cost function calculator to find cost per unit instantly. Enter change in cost and output to make smarter pricing decisions fast.
Try calculatorUse this marginal revenue calculator to find profit per unit fast. Compare cost, revenue, and output to make smarter pricing decisions instantly.
Try calculatorExplore Related Tools
How to Use the Comparative Advantage Calculator
This comparative advantage calculator compares two countries across two products. It checks how much each side gives up to produce one unit. The system then shows who has the lower opportunity cost and should specialize. The result appears instantly with both advantage labels and cost breakdown.
Enter output for Product 1 and Product 2 in Country A
Add how much Country A can produce for both products. These values can be units, hours, or any consistent measure. The calculator stores both numbers and uses them to measure how much of one product is given up to produce the other.
Enter output for Product 1 and Product 2 in Country B
Now input the same two outputs for Country B. Both countries must use the same unit type. The system checks that all values are above zero. If any value is missing or zero, it stops and shows an error.
Click Analyze Trade
Click the button to run the comparison. The calculator divides Product 2 by Product 1 for each country. It also reverses the calculation for Product 2. These two divisions create the opportunity cost for both goods.
Compare each country’s opportunity cost for both goods
The system compares both results side by side. Lower cost means less sacrifice. That country wins the advantage for that product. If costs are equal, the system assigns the result to Country B by default.
Use the result to decide who should specialize in what
The final result shows which country should focus on each product. One side usually wins Product 1. The other wins Product 2. This split helps both sides produce more efficiently and gain from trade.
How do you calculate comparative advantage from a table?
Read the output for both goods in both countries. To find the opportunity cost of one good, divide the other good by the target good. Then compare both countries. This is one of the biggest sticking points in current classroom examples and forum questions.
This classic exam scenario compares two trading nations. Students often struggle with reading these output tables correctly.
Use these inputs in the calculator:
- Country A (USA) produces 100 Wheat (Product 1) or 50 Cloth (Product 2).
- Country B (UK) produces 60 Wheat (Product 1) or 40 Cloth (Product 2).
Process:
- The formula divides the alternative good by the target good.
- USA Wheat Cost: 50 / 100 = 0.50 Cloth
- UK Wheat Cost: 40 / 60 = 0.67 Cloth
Final Result:
USA wins Wheat. UK wins Cloth.
Meaning:
The USA gives up less cloth to grow wheat. It should focus agricultural efforts entirely on wheat production.
How the Comparative Advantage Calculator Works
This comparative advantage calculator uses the standard opportunity cost method taught in economics. It compares what each country or entity gives up to produce one more unit of the other good. That makes the result clear, consistent, and easy to trust for classwork, table questions, and quick specialization checks.
Key Features & Benefits
- Uses the standard two-country, two-good model taught in economics classes.
- Shows both opportunity costs side by side for faster comparison.
- Gives instant specialization guidance after one calculation.
- Works well for table questions, homework, and exam practice.
- Helps separate absolute advantage from comparative advantage clearly.
Technical Process
Input Capture
Reads output values for two goods in two countries and checks that all entries are above zero.
Logic Processing
Calculates each trade-off by dividing one good’s output by the other and compares both sides.
Result Display
Shows the lower opportunity cost as the winner and lists both cost values for quick review.
Comparative Advantage Calculation: Quick Method
A comparative advantage calculation shows which country, business, or producer has the lower opportunity cost for a product. This comparative advantage calculator uses the same method to compare trade-offs and find the better specialization choice.
Use this quick method:
- Pick the product you want to compare.
- Divide the other product’s output by that product’s output.
- Repeat the same calculation for the second country or producer.
- Compare both answers.
- The lower number shows the comparative advantage.
Here is the shortcut:
Other product output ÷ target product output = opportunity cost
This method works best for output tables, classroom questions, trade examples, and business production comparisons. Use the same output type on both sides, such as units per day, tons per month, or items per worker.
How to Find Comparative Advantage From a Table
To find comparative advantage from a table, read the output for both goods and both countries. Pick the target good. Divide the other good’s output by the target good’s output for each country. The lower answer has the comparative advantage.
Use this simple table rule:
Other good ÷ target good = opportunity cost
- If you are checking wheat, divide cloth by wheat.
- If you are checking cloth, divide wheat by cloth.
Many students compare the larger output number or flip the ratio. That mistake points to absolute advantage, not comparative advantage. For comparative advantage, the lower trade-off decides the winner.
How the Comparative Advantage Calculator Formula Works (Complete Breakdown)
This comparative advantage calculator uses simple ratios to measure opportunity cost for each product. It divides one product by the other to show how much must be given up. The lower result shows the better specialization choice.
What is the comparative advantage formula?
The formula uses simple ratios. Opportunity cost of Product 1 equals Product 2 output divided by Product 1 output. The same logic applies in reverse for Product 2. A lower ratio shows a better specialization choice.
					Opportunity Cost of Product 1 for Country A = A Product 2 Output ÷ A Product 1 Output
Opportunity Cost of Product 1 for Country B = B Product 2 Output ÷ B Product 1 Output
Opportunity Cost of Product 2 for Country A = A Product 1 Output ÷ A Product 2 Output
Opportunity Cost of Product 2 for Country B = B Product 1 Output ÷ B Product 2 Output

Comparative Advantage Rule = Lower opportunity cost
This formula shows how much of one good must be given up to produce one unit of the other. The shortcut is simple. Divide the other good by the target good, then compare both countries side by side.
What Each Variable Means
Each value below connects directly to your calculator inputs. These are the numbers used to measure trade-offs between the two products.
A Product 1 Output
This is how many units Country A can produce of Product 1. It is used to calculate how much of Product 2 is given up when producing Product 1.
A Product 2 Output
This is how many units Country A can produce of Product 2. It pairs with Product 1 output to calculate Country A’s opportunity cost.
B Product 1 Output
This shows how many units Country B can produce of Product 1. It is used to compare efficiency against Country A.
B Product 2 Output
This shows how many units Country B can produce of Product 2. It completes the comparison for Country B’s trade-offs.
Opportunity Cost
This shows how much of one product must be given up to produce one unit of another. In this calculator, it appears as values like 2.00 P2 or 0.33 P1, which guide the final decision.
Clarification Note:
The market selector changes page context only. It does not change the calculation. The result depends only on the four output values entered above.
Another Example Calculation (Step-by-Step)
Let’s test a fresh case with coffee and wheat. This example uses new values and follows the same logic used in the calculator.
Given:
- Country A Product 1 Output = 240
- Country A Product 2 Output = 120
- Country B Product 1 Output = 100
- Country B Product 2 Output = 150
Calculation:
					Opportunity Cost of Product 1 for Country A = 120 ÷ 240 = 0.50 Product 2
Opportunity Cost of Product 1 for Country B = 150 ÷ 100 = 1.50 Product 2

Opportunity Cost of Product 2 for Country A = 240 ÷ 120 = 2.00 Product 1
Opportunity Cost of Product 2 for Country B = 100 ÷ 150 = 0.67 Product 1
Result:
- P1 Advantage = Country A
- P2 Advantage = Country B
Meaning:
Country A should focus more on Product 1 because it gives up less of Product 2. Country B should focus more on Product 2 because its trade-off is lower in that direction. This is the pattern users are usually trying to confirm when they search how to calculate comparative advantage from a table.
How Do You Calculate Comparative Advantage?
Calculate the opportunity cost for each good in each country or entity. Divide the other good by the target good, then compare both sides. The lower opportunity cost has the comparative advantage. That result shows who should specialize in what and where trade efficiency is stronger.
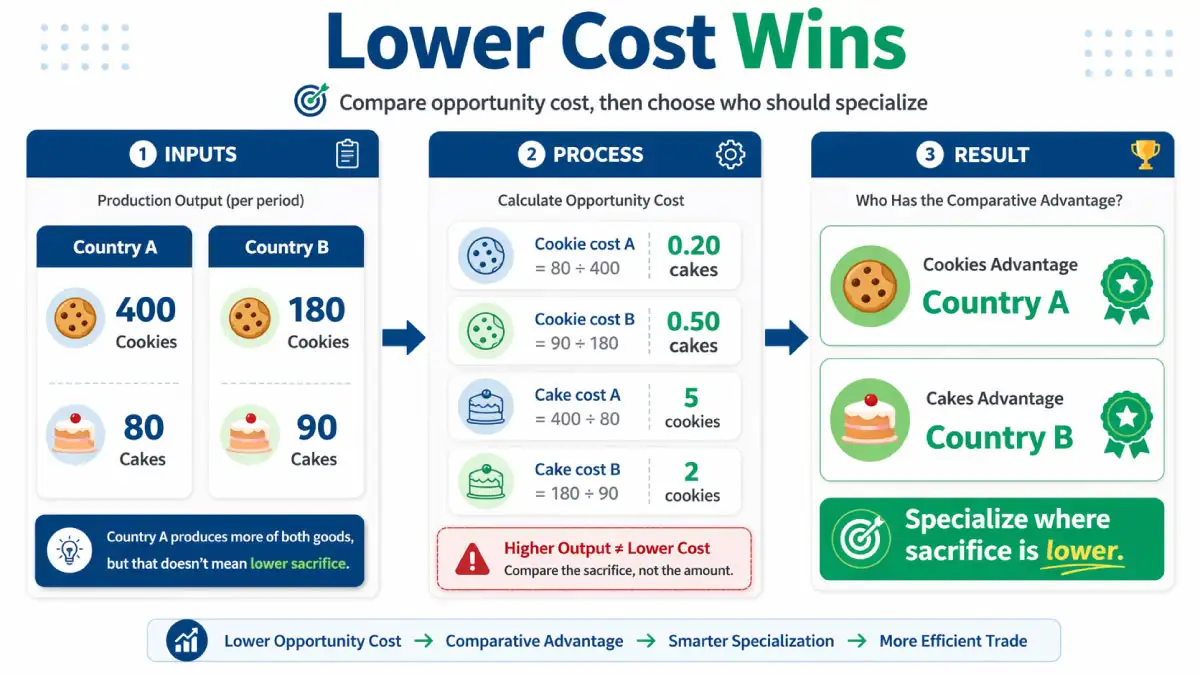
What is the comparative advantage for a small bakery making cookies and cakes?
A local bakery wants to decide which item each team should focus on.
Use these inputs in the calculator:
- Country A Output: 400 Cookies, 80 Cakes
- Country B Output: 180 Cookies, 90 Cakes
Process:
- A cookie costs Team A 0.20 cakes.
- A cookie costs Team B 0.50 cakes.
- A cake costs Team A 5 cookies.
- A cake costs Team B 2 cookies.
Result:
- P1 Advantage: Country A
- P2 Advantage: Country B
Meaning:
Team A should focus on cookies. Team B should focus on cakes.
How do you calculate comparative advantage for shirts and jackets?
A clothing business compares two factories to improve production planning.
Use these inputs in the calculator:
- Country A Output: 240 Shirts, 60 Jackets
- Country B Output: 150 Shirts, 75 Jackets
Process:
- One shirt costs Factory A 0.25 jackets.
- One shirt costs Factory B 0.50 jackets.
- One jacket costs Factory A 4 shirts.
- One jacket costs Factory B 2 shirts.
Result:
- P1 Advantage: Country A
- P2 Advantage: Country B
Meaning:
Factory A should specialize in shirts. Factory B should make jackets.
What is the comparative advantage for a web agency making sites and apps?
A digital agency wants to split work between two teams.
Use these inputs in the calculator:
- Country A Output: 24 Websites, 6 Apps
- Country B Output: 15 Websites, 10 Apps
Process:
- One website costs Team A 0.25 apps.
- One website costs Team B 0.67 apps.
- One app costs Team A 4 websites.
- One app costs Team B 1.50 websites.
Result:
- P1 Advantage: Country A
- P2 Advantage: Country B
Meaning:
Team A should build websites. Team B should focus on apps.
Quick rule to remember
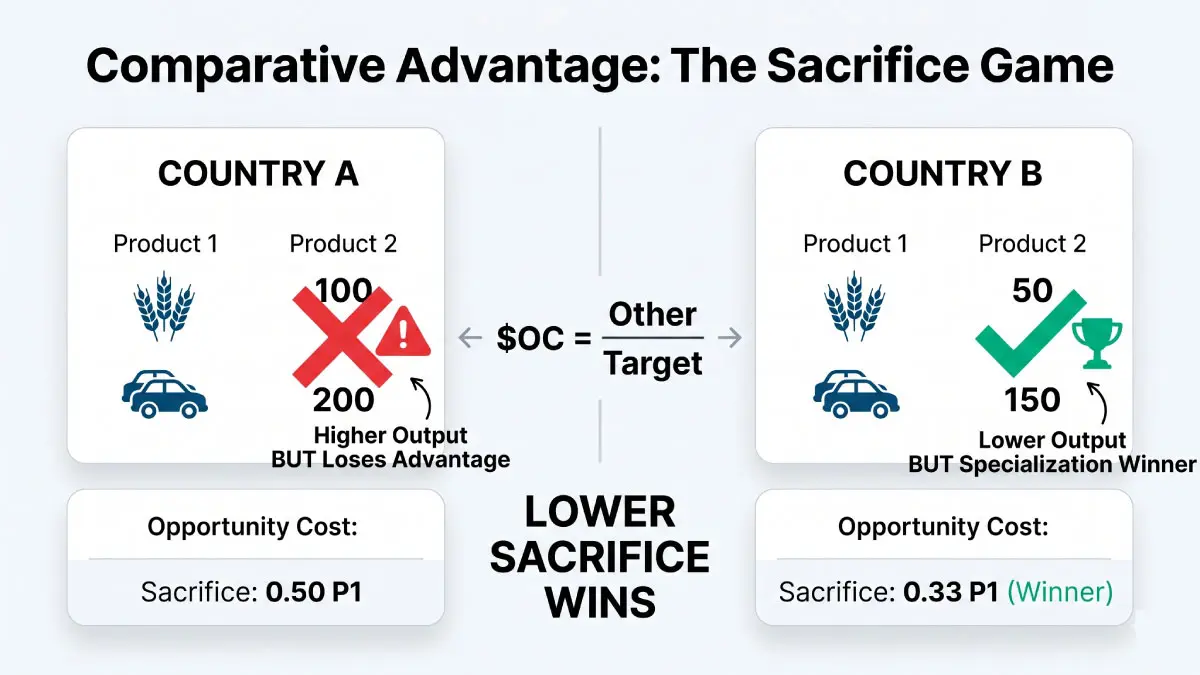
Look at sacrifice, not output. The side that gives up less has the real advantage. Once you know that, enter your own numbers and see who should specialize.
What is Comparative Advantage in Economics?
Comparative advantage means producing a good at a lower opportunity cost than others. It helps countries, businesses, and teams decide where to focus their efforts for better trade outcomes.
One side may produce more of everything and still not be the best choice for every product. What matters is how resources are used and where efficiency is stronger.
This idea explains why trade works. When each side focuses on what it does relatively better, total output increases and both sides can benefit.
Comparative Advantage Benchmark Results
Comparative advantage has no fixed score. It is always a relative comparison. The country with the lower opportunity cost has the advantage, even if its total output is lower.
This comparative advantage calculator uses relative benchmarks, not fixed score bands. Your result only makes sense when compared with the other country’s opportunity cost. The table below shows what each outcome means, when it signals a stronger trade position, and what action usually makes the most sense. Comparative advantage is about lower opportunity cost, while equal opportunity costs imply no clear gains from trade.
| Range | Label | USA Guideline | India Guideline | Notes |
|---|---|---|---|---|
| Lower than the other country’s opportunity cost | Comparative Advantage | Best choice for specialization in class, trade, or business examples. | Strong signal to focus production on that good in economics problems. | This side gives up less and should usually produce more of that good. |
| Higher than the other country’s opportunity cost | Comparative Disadvantage | Usually the weaker specialization choice for that product. | Often better to trade for this good than produce more of it. | The other country has the lower sacrifice and stronger trade position. |
| Equal to the other country’s opportunity cost | No Clear Trade Edge | No strong gain from specialization under the basic model. | Neither side has a clear comparative edge in that good. | Real economics says this is a tie, even if the live tool still assigns a winner. |
| Higher output but higher opportunity cost | Absolute Advantage Only | Can produce more, but still may not be the best specialization pick. | Common exam trap when output looks strong but sacrifice is higher. | More production does not beat a lower trade-off. |
| Lower output but lower opportunity cost | Strong Trade Candidate | May look smaller on output, but still has the better comparative position. | Good choice for specialization when efficiency is stronger than volume. | This side can still gain from trade by focusing on the lower-cost good. |
Heads-up: Comparative advantage is a relative comparison, not a universal score. If both countries have the same opportunity cost, economics treats that as no clear edge. This calculator may still assign Country B in tie cases because of its built-in rule.
Interpretation
These ranges help you read the result fast. A lower opportunity cost is the green zone because it points to the better specialization choice. A higher cost is not a failure. It just means the other side should usually focus on that good. If both costs match, there is no real trade edge in the standard model, even though the current calculator logic may still show a winner. That tie point matters because mainstream teaching treats equal opportunity costs as a case with no comparative advantage and no extra gains from specializing.
Optional Pro Tip
Check both products before making a decision. One country can produce more of everything and still lose on comparative advantage if its opportunity cost is higher. That confusion shows up often in current teaching pages and forum questions, so use the lower sacrifice as your real benchmark.
What to Do After Using the Comparative Advantage Calculator
Your result is only useful if it changes a decision. The next step is to use the comparative advantage calculator to spot your relative strength, avoid weak specialization choices, and check whether the result still holds once real-world trade costs enter the picture. Current explainers and forum discussions keep circling the same issue: users often focus on bigger output when they should focus on lower opportunity cost.

Focus on Your Relative Strengths
Focus on your relative strengths. If one side has the lower opportunity cost by a clear margin, that is the product it should usually specialize in. A country, factory, or team can produce more overall and still lose on comparative advantage if the sacrifice is higher. That is one of the most common mistakes people make after seeing the result.
Negotiate Better Trade Deals
Negotiate better trade deals. The calculator compares pure trade-offs, but real trade also includes tariffs, transport costs, and other barriers. A strong classroom result may weaken once those costs are added. Use the result as a starting point, then test whether the advantage still makes sense after trade frictions are included. That is where many real business decisions change.
Monitor Global Technology Shifts
Monitor global technology shifts. When the two sides look close, small changes in tools, labor skill, automation, or production methods can flip the result. Recheck the ratio direction before trusting a tight comparison. Then review the numbers again if technology or productivity changes. Comparative advantage can move over time when production conditions change.
You Might Also Find These Helpful
Economics 6
No tools published here yet.
Related Tools People Use Next
Is Revealed Comparative Advantage the Same Thing?
Revealed comparative advantage is not the same as this calculator’s output method. This calculator compares production trade-offs between two goods. Revealed comparative advantage uses export data to estimate whether a country is unusually strong in exporting a product compared with the world market.
In UK economics, trade policy, and export analysis, this is often called RCA or the Balassa index. It looks at trade patterns after they happen. Your calculator works before that point. It compares possible production choices using opportunity cost.
The basic idea is simple. RCA compares a product’s share of a country’s exports with that product’s share of world exports. If the result is above 1, the country is usually said to have a revealed comparative advantage in that product.
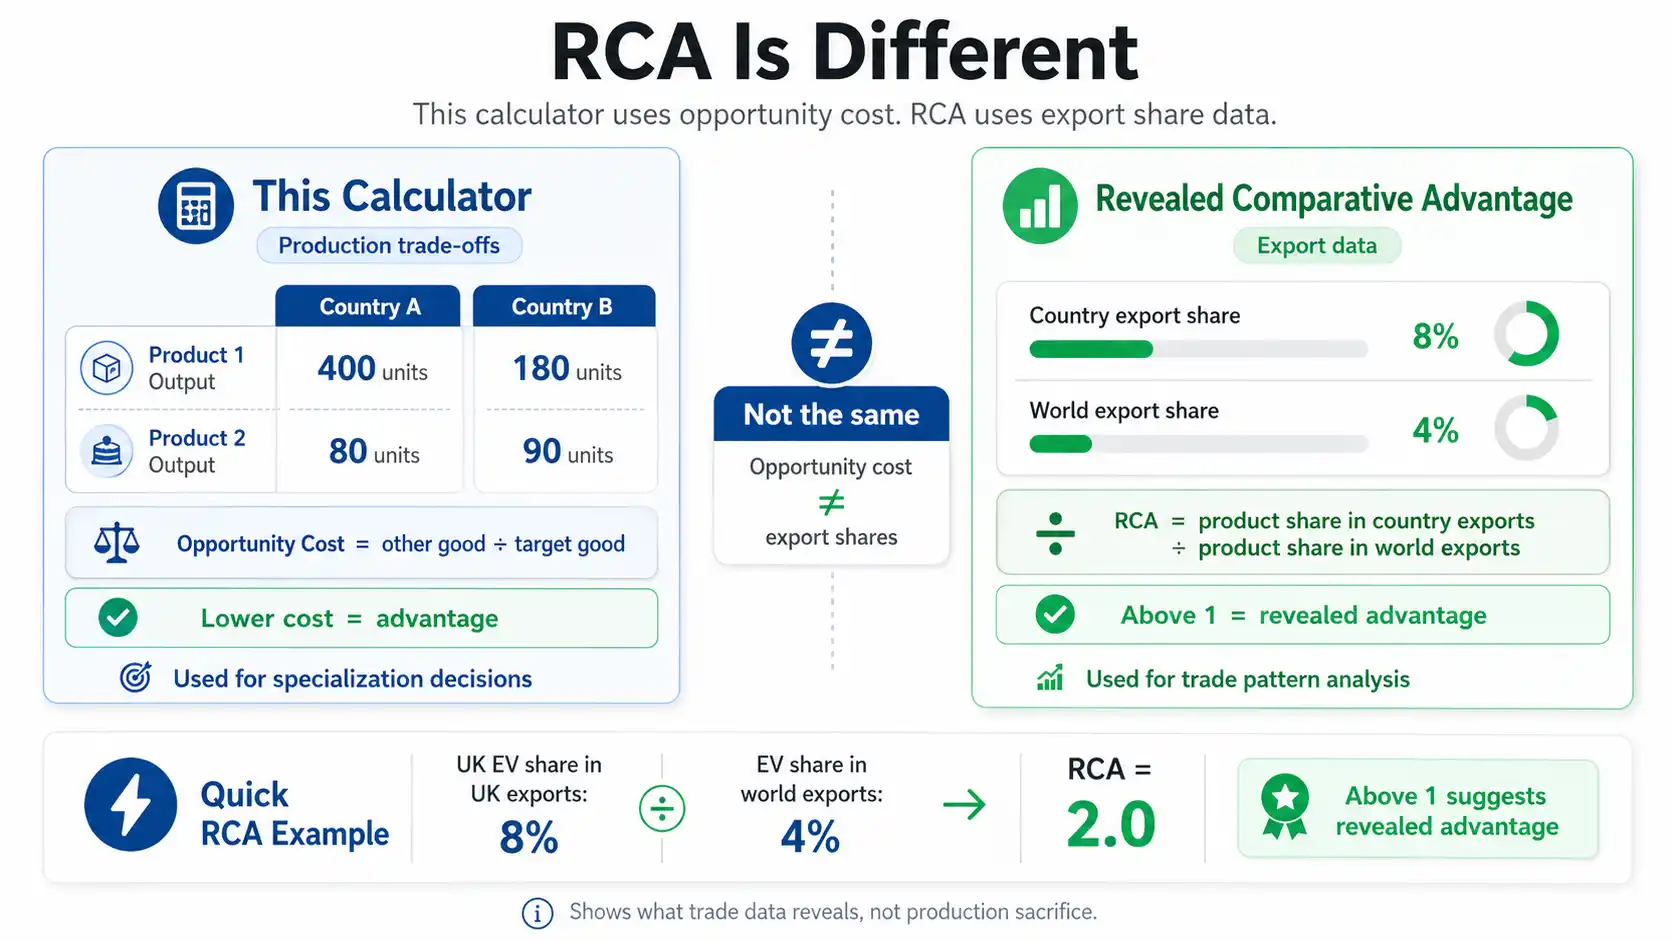
Simple RCA formula:
RCA = Product share in country exports ÷ Product share in world exports
So if electric vehicles make up a larger share of the UK’s exports than they do in world exports, the UK may show a revealed comparative advantage in that product group. This does not prove why the advantage exists. It only shows what trade data reveals.
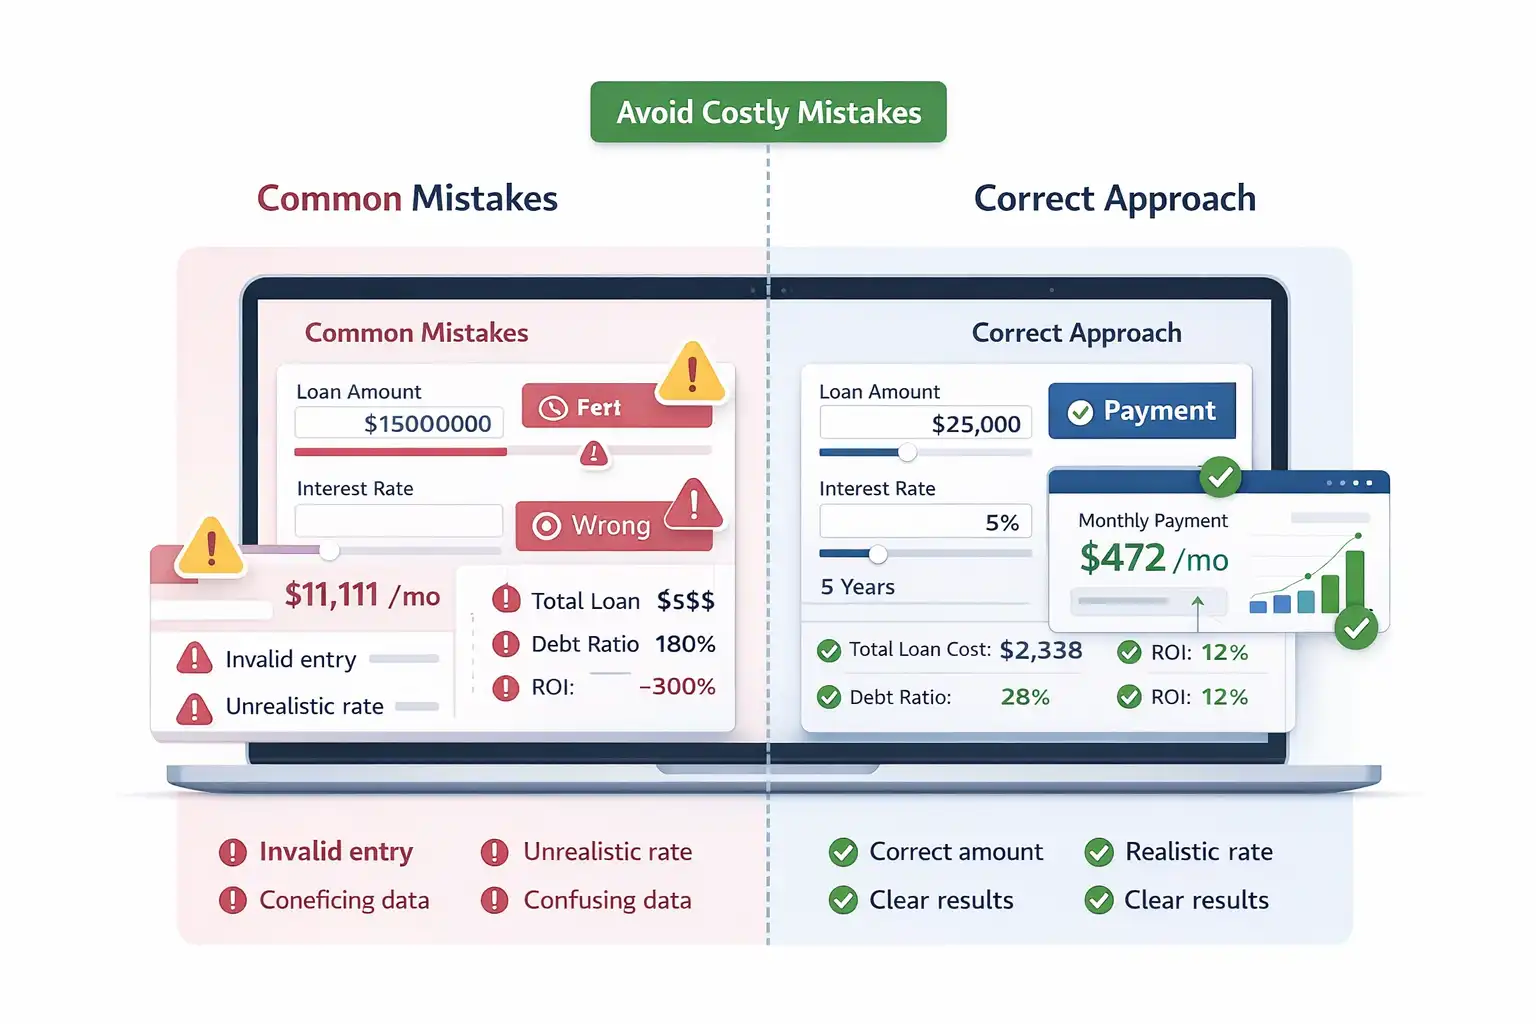
Common Mistakes When Using the Comparative Advantage Calculator
Many wrong answers come from small input or logic errors. Most users do not struggle with the idea itself. They struggle with direction, comparison, and what the result actually represents. Fixing these mistakes makes your comparative advantage calculator result accurate and easy to trust.
- Mixing up absolute advantage with comparative advantage and choosing the higher output side
- Dividing the numbers in the wrong direction when calculating opportunity cost
- Comparing total production instead of comparing opportunity cost values
- Treating the result like a profit, forex, or revenue decision tool
- Ignoring equal or very close costs and assuming a clear winner without checking ratios
Frequently Asked Questions (FAQs)
How is comparative advantage measured?
Comparative advantage is measured by opportunity cost, not by total output. A lower opportunity cost means one side gives up less of the other good to produce one more unit. That lower sacrifice is what shows the stronger specialization choice.
Can one country have comparative advantage in both goods?
In the standard two-country, two-good model, no. Comparative advantage depends on relative opportunity cost, so one side usually has the edge in one good and the other side has the edge in the other. That is why specialization creates gains from trade.
What is the difference between absolute and comparative advantage?
Absolute advantage means producing more with the same resources. Comparative advantage means producing at a lower opportunity cost. One country can have absolute advantage in both goods and still have comparative advantage in only one, because trade-offs still differ across goods.
How do you calculate opportunity cost for comparative advantage?
To calculate opportunity cost, divide the output of the other good by the output of the good you are evaluating. That tells you what must be given up to produce one unit. Comparative advantage goes to the side with the lower result.
Why is specialization important in trade?
Specialization matters because it lets each side focus on the good it produces at a lower opportunity cost. That usually raises total output after trade. This is also why countries, firms, and even workers can benefit from trade even when one side looks stronger overall.
How does trade help if one country has an absolute advantage in everything?
Trade can still help because absolute advantage is not the same as comparative advantage. Even if one country produces more of both goods, it still gives up one good faster than the other. Specializing by lower opportunity cost can still increase total output.
Does comparative advantage mean a country is richer?
No, comparative advantage only measures production efficiency and opportunity cost. It does not measure national wealth, currency strength, or overall GDP. A poorer country can easily hold a comparative advantage over a wealthy nation in a specific industry.
What happens if both countries have the same opportunity cost?
If both countries have the same opportunity cost for a good, there is no clear comparative advantage in the standard model. That means no strong trade edge for that product. On this page, the live calculator may still assign Country B because of its built-in tie rule.
How do you know who has the comparative advantage quickly?
Compare opportunity cost, not total output. The side with the lower cost for a product has the advantage. A quick check is to divide the other good by the target good and compare both results.
Does this calculator show profit, trade balance, or forex advantage?
No. This calculator only compares opportunity costs and specialization choices. It does not include prices, wages, tariffs, shipping costs, exchange rates, or profit margins. It is a trade-off tool, not a forecasting or market pricing tool.
How is revealed comparative advantage calculated?
Revealed comparative advantage is calculated by dividing a product’s share of a country’s exports by that product’s share of world exports. If the result is above 1, the country is usually considered to have a revealed comparative advantage in that product or industry.
For example, UK analysts may use RCA to compare export strengths across sectors such as finance, pharmaceuticals, machinery, or food products.
Questions?
We had love to hear from you! Whether you are reporting an issue, suggesting a new calculator, or exploring collaboration opportunities — we are here to help. Every message helps us make 100calc smarter, faster, and more helpful for everyone.
Why People Trust 100calc
At 100calc.com, we focus on accuracy, speed, and trust. Every calculator we create is designed to give reliable, instant, and easy-to-understand results you can truly depend on.