hCG Range Calculator: Check Your Beta Levels by Week or DPO
An hCG range calculator determines the standard clinical boundaries for your specific stage of early pregnancy. It works by mapping your current weeks or exact Days Past Ovulation (DPO) against established medical brackets. You can enter your quantitative blood test result. The system will plot your exact percentile against median singleton and twin averages.
Are you panicking over a blood test result that looks abnormally low or shockingly high? Early pregnancy hormone ranges span tens of thousands of units. This massive overlap makes raw numbers terrifying without proper context. Your single beta value means nothing on its own. You must compare it against the true clinical median for your exact timeline.
Select your natural pregnancy week or IVF transfer date below. Our visual analyzer will instantly reveal your status. You will discover if your beta levels are tracking low or perfectly average. It will also highlight if your numbers are high enough to suggest multiples.
Quick Facts
- Unit equality: A value of 1 mIU/mL matches 1 IU/L exactly.
- The golden rule: Doctors prioritize a 48-hour doubling trend over single static numbers.
- Natural plateau: Beta hormone production peaks between weeks 9 and 12 before naturally declining.
- Ultrasound shift: Visual scans become the primary tracking tool once levels cross 1,500 mIU/mL.
- Updated Jun 12, 2026
- Reviewed by 100Calc Research Team
Pregnancy & Fertility Calculator
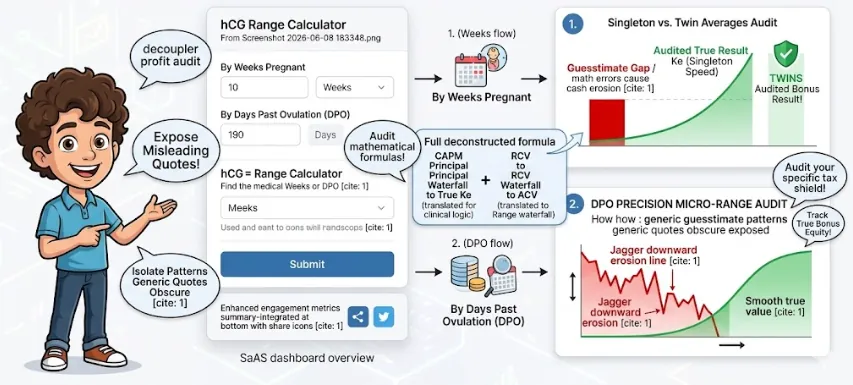
hCG Range Calculator
Find the exact medical hCG range for your stage of pregnancy. Optionally enter your lab result to see how it compares to singleton and twin averages.
Select this to see the standard clinical range based on your last menstrual period (LMP).
What you need
Select your timeline below to generate your expected range. You can also enter your quantitative Beta hCG level to visualize exactly where your number sits on the spectrum.
Expected Clinical Range
— to — mIU/mL
Your timeline meaning will appear here.
Range Analyzer
Comparing your level against clinical medians for this exact timeframe.
Clinical assessment
Your personalized assessment will appear here after calculation.
Medical note
Important: 1 mIU/mL is exactly equivalent to 1 IU/L. Because normal hCG ranges are incredibly wide, doctors rely on how fast your numbers double over 48 hours rather than a single static number.
Quick answer
A direct, snippet-style answer based on your inputs will appear here.
What is the normal range of hCG in early pregnancy?
Your first dynamic answer will appear here after calculation.
Can the hCG range calculator detect twins?
Your second dynamic answer will appear here after calculation.
What Your Clinical Range Means
Your output defines exactly where your blood test sits inside standard medical reference brackets. The analyzer plots your value between the absolute clinical minimum and maximum boundaries, comparing it directly against established medians.
Understanding Your Result
The analyzer plots your exact number on a biological spectrum. It maps your value between the absolute clinical minimum and maximum boundaries.
The system then compares your blood test directly against established medians for singletons and multiples. This replaces raw data confusion with clear medical context.
Is Your Result Good or Bad?
A standard result lands near the expected singleton median. This confirms a perfectly normal early development trend.
Falling into the low-normal bracket is extremely common. It usually points to a slight delay in embryo implantation. However, dropping entirely below the expected minimum requires close monitoring. A chemical pregnancy typically shows rapidly dropping numbers, whereas an ectopic pregnancy or blighted ovum often shows numbers that rise, but at an abnormally slow, sluggish pace.
High numbers track at or above the average for twins. Healthy singletons frequently reach these massive levels, but multiple pregnancies consistently sit in this upper bracket.
What You Should Do Next
- Request a second quantitative blood draw exactly 48 hours after your first test.
- Compare both numbers to confirm a healthy exponential doubling time.
- Schedule a transvaginal ultrasound appointment once your hormone levels cross 1,500 mIU/mL.
- Allow your doctor to measure the fetal crown-rump length for exact pregnancy dating.
A Quick Example to Test
Let us say you receive your early IVF blood work from the clinic. Enter these exact values into the calculator above.
Input:
- Tracking Mode: By Days Past Ovulation (DPO)
- Days Past Ovulation: 14
- Your Beta hCG level: 35 mIU/mL
Result:
Low-Normal Range.
Meaning:
Your level sits safely above the minimum threshold but below the singleton median. This is extremely common and usually points to late implantation. Doctors typically request a 48-hour repeat test to verify growth.
Why Do Normal hCG Ranges Vary So Much?
Normal hCG ranges vary drastically. Every person’s placenta develops at a completely different biological speed. Hormone production multiplies exponentially during early pregnancy. A slight delay in embryo implantation changes everything. It can shift your blood test numbers by thousands of units within a few days.
Early pregnancy hormones grow on a steep exponential curve. This means the numbers do not just add up daily. They multiply. Numbers double constantly in the first trimester. This makes the gap between the lowest and highest normal levels massive.
Two women could be exactly five weeks pregnant. One patient might have a beta level of 200 mIU/mL. The other shows 7,000 mIU/mL. Both numbers fall safely inside the standard medical baseline. The exact number matters much less than the underlying growth trend.
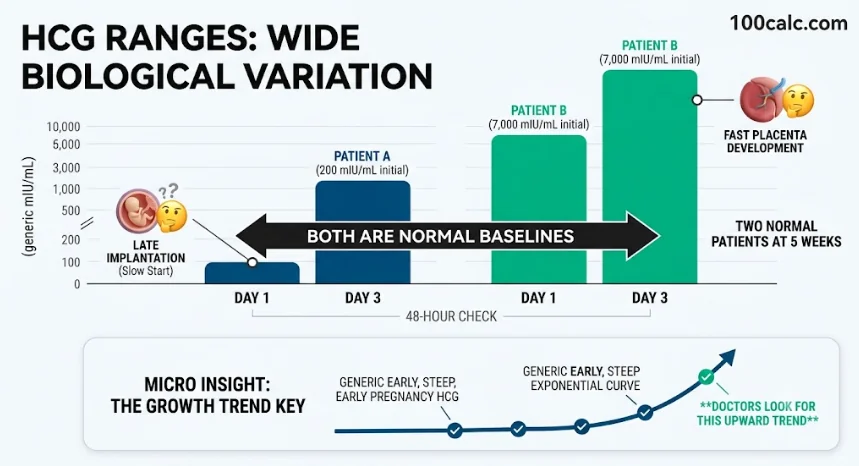
Why this matters
This massive natural variation explains why doctors never diagnose a pregnancy using a single blood test. A reliable clinical assessment requires two blood draws spaced 48 hours apart. This second test confirms your hormones are doubling correctly.
Explore More Calculators
Use this fetal growth calculator to check baby weight percentile from ultrasound data in grams, kg, or cm and see what the result means…
Try calculatorEnter gestational sac measurements in mm or cm to calculate mean sac diameter, estimate early gestational age, compare week-by-week milestones, and see when follow-up…
Try calculatorMissed a birth control pill? Check pregnancy risk, protection status, backup contraception needs, and what to do next with our missed pill calculator.
Try calculatorUse our Pregnancy Chance Calculator to estimate your odds. Enter your cycle day, age, and method. Find out if you are in the high-risk…
Try calculatorUse our pregnancy due date calculator to find your exact Baby Due date. IVF, conception, ovulation, and ultrasound methods with weeks and timeline.
Try calculatorUse this Pregnancy Risk Calculator to check age, BMI, health history, bleeding, and twins. See if closer prenatal monitoring may be worth asking about.
Try calculatorHow to Use the hCG Range Calculator
This tool maps your early pregnancy hormone levels against standard medical boundaries. It uses your exact timeline to generate the correct clinical baseline. Follow these five simple steps to run the comparison and check your status.
Select Your Tracking Method
Choose whether to use standard weekly tracking or precision DPO tracking. Natural conceptions typically rely on the weekly method based on the last menstrual period. Patients utilizing assisted reproduction require the precision tracking mode.
Enter Your Timeline
Select your current pregnancy week from the drop-down menu if using standard tracking. Type your exact Days Past Ovulation into the input box if you require precision tracking. This data tells the system which clinical bracket to reference.
Add Your Blood Result
Type your quantitative beta hCG level directly from your laboratory report. This step is entirely optional. If you skip this step, the system will still generate the standard medical range for your specific timeline without activating the visual analyzer.
Run the Analysis
Click the main calculate button to process your entered data. The algorithm immediately matches your timeline against established clinical minimum and maximum boundaries. It filters overlapping data to find your precise expected baseline without any manual math required.
Review Your Visual Gauge
Check where your specific level falls compared to the singleton and twin average markers. The screen instantly plots your percentile on a visual gauge. It highlights if your numbers are tracking below expected, low-normal, or within the high multiple bracket.
How do you check if your beta level is normal for a natural six-week pregnancy?
Let us say you want to verify your numbers before your first ultrasound. Use these exact inputs to test the visual analyzer logic.
Use these inputs in the calculator:
- Calculation Mode: By Weeks
- Pregnant Weeks: 6 weeks
- Your Beta hCG level: 20,000 mIU/mL
Process:
The system checks your entered hormone level against the clinical boundaries established for a standard six-week pregnancy. It maps your value between the 1,080 minimum and 56,500 maximum.
Final Result:
Status: Strong Average.
Meaning:
Your hormone level falls safely above the 15,000 singleton median. You pass the correlation check easily. Your numbers are tracking perfectly for a standard healthy pregnancy at this exact gestational stage.
How the hCG Range Formula Works (Complete Breakdown)
The hCG range calculator maps your raw laboratory data using a standard mathematical equation. This calculation reveals your relative position within massive early pregnancy hormone brackets. Knowing your exact location on the spectrum helps clarify overlapping boundaries before your first diagnostic ultrasound.
What is the hCG range percentile formula?
The medical formula calculates exactly where your hormone level sits between the absolute lowest and highest expected values for your timeline. You subtract the minimum boundary from your result, divide that number by the total size of the bracket, and multiply by 100 to get a percentage.
Percentile = ((hCG - Minimum) / (Maximum - Minimum)) × 100
This mathematical equation removes the confusion of overlapping clinical ranges. Instead of just telling you if a number is vaguely “normal,” it isolates your exact biological speed. Doctors use this relative positioning to see if you are tracking in the low-normal, average, or high range.
What Each Variable Means
Every component inside this math links directly to your clinical lab metrics and established tracking tables. These values calculate your precise placement on the geometric curve of maternal hormone production.
Percentile
Your relative location appears as a precise value on a zero to 100 scale. The code processes this percentage to position your pointer on the visual graph and determine your numerical classification.
hCG
The quantitative beta serum level comes straight from your medical lab printout sheet. The mathematical equation handles this exact value as the primary input anchor for the entire comparative calculation.
Minimum
The clinical floor boundary acts as the lowest textbook limit for your chosen week or DPO. Reference data sets this specific threshold as the baseline zero point for the tracking bar.
Maximum
The clinical ceiling boundary defines the top normal limit for your specific timeframe. The equation uses this highest expected medical value to establish the absolute ceiling for the comparative spectrum.
Another Example Calculation (Step-by-Step)
Let us see how the formula functions using a precision IVF scenario. This helps you track how the system plots variable data within a tight daily boundary without errors.
Given:
- hCG Level = 80 mIU/mL
- Timeline = 14 Days Past Ovulation (DPO)
- Minimum Baseline = 10 mIU/mL
- Maximum Baseline = 120 mIU/mL
Calculation:
					hCG Level = 80 mIU/mL
Timeline = 14 Days Past Ovulation (DPO)
Minimum Baseline = 10 mIU/mL
Maximum Baseline = 120 mIU/mL
Result:
- Calculated Percentile: 63.6%
- Assigned Status: High Range (Multiples?)
Meaning:
Your baseline sits at the 63.6 percent mark of the textbook 14 DPO boundary line. Because this value exceeds the 59 mIU/mL twin average, it triggers a high-range status. While perfectly healthy for singletons, multiples frequently sit in this upper bracket.
Early Pregnancy hCG Range Chart
If you are tracking your pregnancy from your Last Menstrual Period (LMP), your numbers should fall within these standard clinical boundaries. Remember, a single serum beta test is just a snapshot—the doubling trend is what matters.
| Weeks Pregnant (from LMP) | Expected hCG Range (mIU/mL or IU/L) |
|---|---|
| 3 Weeks | 5 – 50 |
| 4 Weeks | 5 – 426 |
| 5 Weeks | 18 – 7,340 |
| 6 Weeks | 1,080 – 56,500 |
| 7 to 8 Weeks | 7,650 – 229,000 |
| 9 to 12 Weeks (Peak) | 25,700 – 288,000 |
Medical Note: A single serum beta test is just a snapshot. Doctors rely on a 48-hour doubling trend to confirm viability, not a single static number.
You Might Also Find These Helpful
Pregnancy & Fertility 31
BPD gestational age calculator: estimate fetal age from BPD, compare your week, check normal BPD ranges, and understand ahead or behind results.
Try calculatorCalculate odds with the Chance of Twins Calculator. Enter maternal age and history. Find your probability instantly. See if you will conceive multiples now.
Try calculatorFind out exactly when you conceived. Our free Conception Calculator uses your Due Date, LMP, or Ultrasound to estimate your fertilization date and fertile…
Try calculatorUse our Conception Date Due Date Calculator to find your baby's arrival date. Enter your conception or intercourse date for clinical 40-week results.
Try calculatorContraceptive effectiveness calculator to compare birth control methods, typical vs perfect use, backup protection, and 5-year pregnancy risk.
Try calculatorUse this CRL calculator to estimate gestational age and due date from crown-rump length in mm or cm. Compare CRL, LMP, and IVF dating…
Try calculatorEstimate your monthly and 12-month pregnancy odds by age, partner age, and cycle dates. See your fertile window and when to seek fertility help.
Try calculatorUse this fundal height calculator to compare your cm measurement by week, check growth range, estimate baby weight, and know when to ask about…
Try calculatorPanicking over your hCG levels? Use our hCG 48-Hour Calculator to compare your exact beta rise against the ACOG 35% minimum viability benchmark instantly.
Try calculatorCalculate hCG doubling time instantly. Enter two test results. See if your levels are rising normally. Check pregnancy progress now in the hCG Calculator.
Try calculatorCheck your beta hCG rise with this hCG doubling time calculator. Enter two blood tests to see doubling time, 48-hour increase, and early trend…
Try calculatorConfused by your beta hCG levels? Use our hcg gestational age calculator to estimate your pregnancy weeks, verify IVF dates, and check ultrasound milestones.
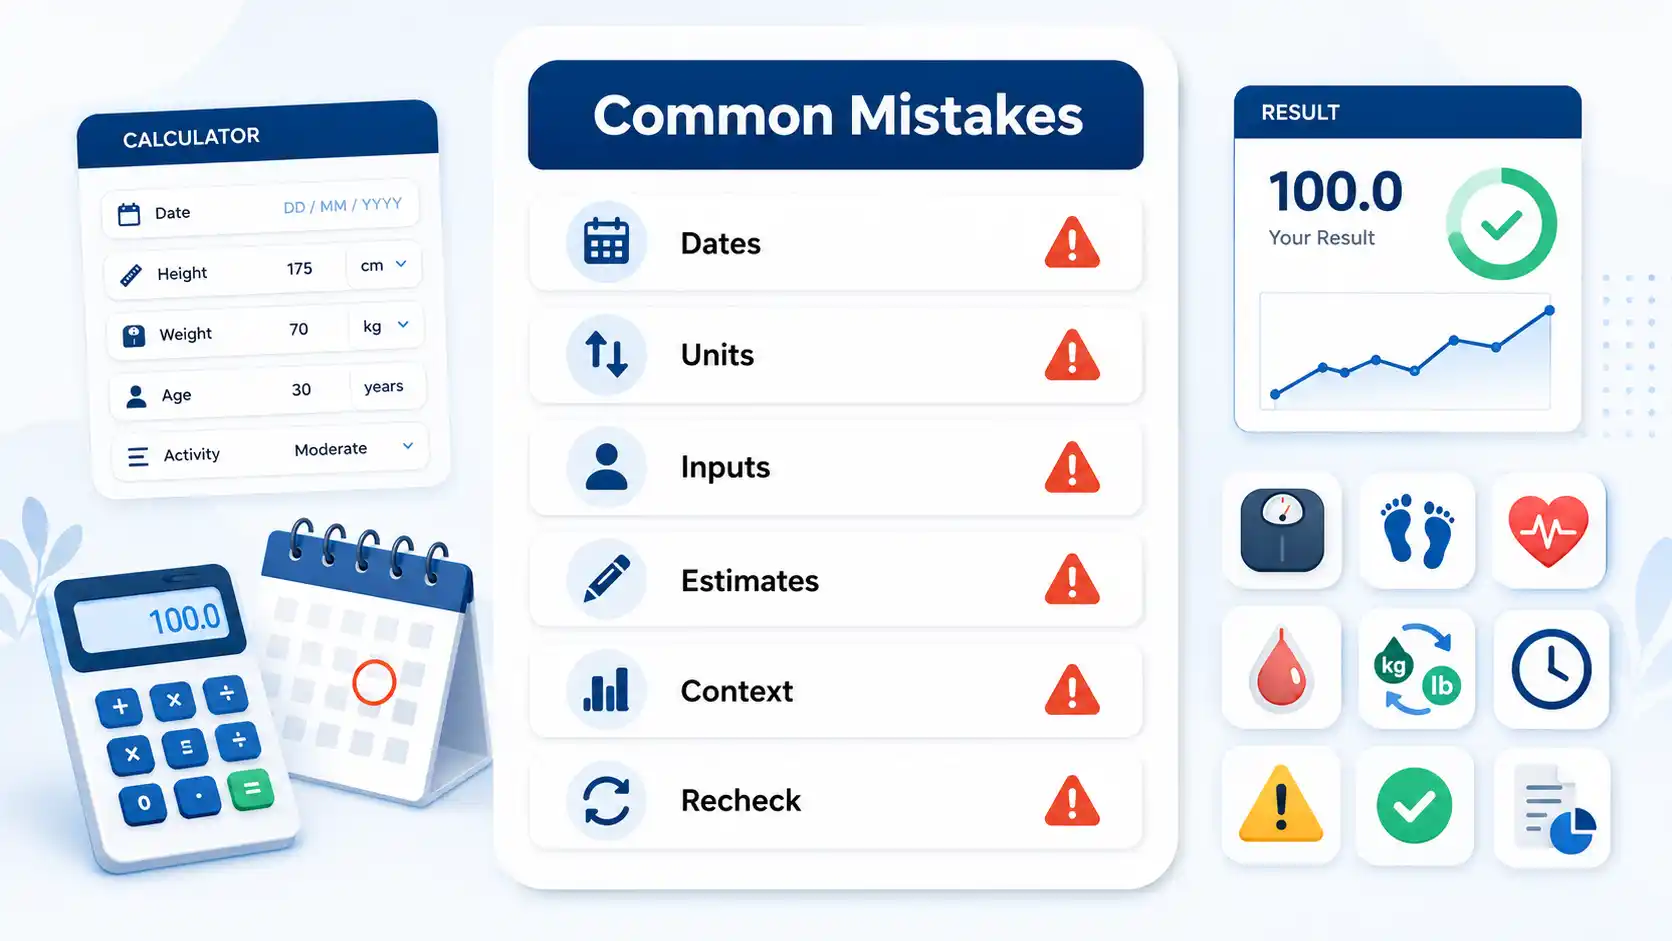
Try calculatorCommon Mistakes When Using the hCG Range Calculator
Many users misinterpret their early pregnancy blood test results by choosing the wrong timeline baseline. Entering incorrect tracking dates or ignoring massive clinical boundaries often triggers unnecessary anxiety. Avoid these common input errors to ensure your visual analyzer displays accurate percentiles.
- Trusting a single static blood test number instead of measuring your complete 48-hour doubling trend.
- Assuming a high percentile result provides absolute medical confirmation of a multiple or twin pregnancy.
- Selecting standard weekly tracking instead of exact DPO when checking your IVF embryo transfer dates.
- Panicking over a natural beta hormone drop that normally occurs between weeks nine and twelve.
- Typing a qualitative home urine test threshold instead of your exact quantitative laboratory serum level.
Medical Disclaimer
This tool offers educational information only. It is not a substitute for professional medical diagnosis, advice, or treatment. Always consult your doctor or a talented healthcare expert regarding any health concerns. Do not ignore or delay professional medical help based on information or results generated by this site.
Frequently Asked Questions (FAQs)
What is the normal range of hCG at 4 weeks?
The expected clinical range spans from 5 to 426 mIU/mL. Because these early brackets are so wide, doctors rely on 48-hour doubling times rather than a single static number to determine viability.
Can the hCG range calculator detect twins?
No, a calculator cannot definitively detect twins. However, extremely high hormone levels often push into the median brackets expected for multiples. Because many healthy singleton pregnancies also produce elevated beta numbers, you
Why is my hCG level lower than average?
A low-normal result usually points to the embryo implanting a day or two later than estimated. Miscalculating your exact ovulation date is the most frequent reason for lower-than-expected initial numbers. Doctors will request a repeat test to verify healthy exponential growth.
Are mIU/mL and IU/L the same for hCG tests?
Yes. These two medical units are exactly equivalent in clinical laboratory testing. A blood test result of 500 mIU/mL is mathematically identical to 500 IU/L. You can enter either unit into the system without changing the output.
At what hCG level can an ultrasound confirm pregnancy?
A gestational sac usually becomes visible on a transvaginal ultrasound once your hormone levels cross 1,500 to 2,000 mIU/mL. Medical professionals rely on this physical visual milestone rather than continued blood tests to confirm a viable intrauterine pregnancy.
When do hCG levels peak and start dropping?
Hormone production typically reaches its absolute maximum limit between weeks 9 and 12 of pregnancy. Levels naturally decline and plateau for the remainder of the second and third trimesters. This mid-trimester drop is a completely normal physiological process.
How do I calculate DPO for an IVF transfer?
Add the age of the transferred embryo to the number of days since your clinical procedure. A 5-day blastocyst measured 9 days after transfer equals exactly 14 Days Past Ovulation. This precise timeline ensures accurate medical median comparisons.
Can a home pregnancy test show my exact hCG range?
Home urine strips only provide a qualitative yes or no answer based on minimum detection thresholds. You must request a quantitative beta blood test from a diagnostic laboratory to discover your exact numerical level and check your clinical range.
Questions?
We had love to hear from you! Whether you are reporting an issue, suggesting a new calculator, or exploring collaboration opportunities — we are here to help. Every message helps us make 100calc smarter, faster, and more helpful for everyone.
Why People Trust 100calc
At 100calc.com, we focus on accuracy, speed, and trust. Every calculator we create is designed to give reliable, instant, and easy-to-understand results you can truly depend on.