Pregnancy Test Line Calculator: Check Your Progression
A pregnancy test line calculator evaluates your early hormone progression by analyzing the visual darkness of your test strip. You match your home test result to an interactive digital slider. The system maps that specific darkness to a clinical hCG range to determine if your progression aligns with your dates.
Are you obsessively comparing today’s test to yesterday’s? Staring at faint shadows causes massive anxiety. You might panic over a stalled line. Many women do not realize that physical strips hit maximum dye saturation by 15 DPO. Your test might even get lighter later in the first trimester due to the confusing hook effect.
Stop guessing. Enter your exact days past ovulation or pregnancy weeks below. Move the visual slider to match your physical test. You will instantly see your estimated hormone bracket. The analyzer reveals if your progression is tracking safely, signaling potential multiples, or warning of a stall.
Quick Facts
- Dye Stealers: Test lines darker than the control line indicate very high hCG. This sometimes points to a twin pregnancy.
- The Hook Effect: Massively high hormones around 8 weeks can overwhelm the test chemistry. This creates falsely faint lines.
- Dye Saturation: Visual progression often stalls around 14 to 17 DPO because the physical strip cannot absorb more ink.
- The Ultimate Limit: Visual darkness provides early comfort. Only a quantitative blood test confirms an exact doubling time.
- Updated Jun 16, 2026
- Reviewed by 100Calc Research Team
Pregnancy & Fertility Calculator
Pregnancy Test Line Analyzer
Match your home pregnancy test line to our visual slider to estimate your hCG level, check line progression, and learn if your result is normal for your dates.
Select this if you know exactly when you ovulated or had an IUI/IVF transfer.
How to use this tool
Enter your timeline below, then move the slider to match the darkness of the test line (T) compared to the control line (C) on a standard early response test (like First Signal or Clearblue pink dye).
Progression Assessment
—
Your timeline meaning will appear here.
Estimated hCG Level
Your estimated hCG range will appear here.
⚠️ The Hook Effect
At your stage of pregnancy, hCG levels are often so massively high (>50,000 mIU/mL) that they overwhelm home urine tests, causing the line to look strangely faint. Diluting your urine with water and testing again often yields a darker line.
✨ High hCG / Multiples Indicator
Getting a "Dye Stealer" this early indicates rapidly rising, very high hCG. While many healthy singleton pregnancies do this, exceptionally dark lines very early are highly associated with twin or multiple pregnancies.
Test Strip Anatomy
The Control Line (C) ensures the test worked. The Test Line (T) reacts to hCG. A Dye Stealer happens when hCG is so high it literally pulls the chemical dye away from the Control line, making the T line darker than the C line.
Quick answer
A direct, snippet-style answer based on your inputs will appear here.
How strong should the line be on a pregnancy test?
Your first dynamic answer will appear here after calculation.
Can a twin pregnancy test line calculator predict multiples?
Your second dynamic answer will appear here after calculation.
What Your Test Line Assessment Means
Your result clarifies if your visual line darkness aligns with clinical expectations for your specific timeline. It evaluates the chemical strip intensity against typical hormone development milestones.
Understanding Your Result
The analyzer translates the chemical reaction on your test strip into a quantitative hormone estimate. It maps the visual ink color to standard biological brackets. This replaces guesswork with direct numerical ranges.
Knowing your placement helps you monitor initial development from home. It reveals if your body is producing the necessary early signals at the correct speed. This context tells you whether your timeline matches your test appearance.
Is Your Result Good or Bad?
Normal progression shows lines getting steadily darker every forty-eight hours. Matching the median bracket confirms healthy early development. It means your body is tracking exactly as expected.
Slower progression highlights a line that is too light for your dates. This can indicate later implantation or varying urine concentration. It may also flag a potential risk requiring professional review.
Rapid progression means your test line is exceptionally dark very early. High hormone speeds can point to a multiple pregnancy. However, healthy singletons also frequently cross into this upper bracket.
What You Should Do Next
- Test again in forty-eight hours using first morning urine to check the ongoing progression trend.
- Limit your liquid intake for four hours before taking any home test to prevent artificial dilution.
- Request a quantitative beta blood test from a medical clinic to measure your exact hormone numbers.
- Schedule an early prenatal ultrasound appointment to confirm placement and look for a gestational sac.
![An explanatory infographic detailing the underlying Equity Audit logic of the Pregnancy Test Line calculator Analyzer on 100calc.com. It features a dynamic multi-category guidance pipeline deconstructing data from image_141.png. Pointers define visual frameworks for Macro, Tax Shield, and Equity Audits, decoupling nominal guesstimate traps from a true bonus profit audit [cite: 1]. The visualization includes illustrative stacked charts and formula deconstructions (e.g., Kd(1-T)) to prove how inefficiency caused cash erosion gaps are exposed, separating true bonus equity from nominal speed [cite: 1]. Zero generic patterns repeated, and all text is mobile readable [cite: 1].](https://100calc.com/wp-content/uploads/2026/06/pregnancy-test-line-calculator-analyzer-infographic.webp)
A Quick Example to Test
Let us say you are tracking your home test results closely after a suspected conception date. Enter these exact values into the calculator to verify system logic.
Input:
- Tracking Mode: By Days Past Ovulation (DPO)
- Days Past Ovulation: 13
- DPO Test Line Darkness Matcher: Level 4 (Darker than Control)
Result:
Rapid Progression.
Meaning:
Your line darkness matches the expected hormone brackets for a much later stage. This means your hormone level sits between 1,000 and 5,000 mIU/mL. It indicates highly active cellular growth that warrants a follow-up blood test.
Why Do Pregnancy Test Lines Stop Getting Darker?
Pregnancy test lines stop darkening because the physical strip reaches maximum dye saturation, usually around 15 Days Past Ovulation. Once the reactive antibodies inside the test window absorb all available pink or blue ink, higher hormone levels cannot physically make the line any darker.
Many women testing daily experience intense anxiety when their visual progression stalls or fades slightly. This is rarely a sign of early pregnancy loss. Home urine tests are strictly qualitative tools. They are designed only to confirm the presence of hormones, not to measure exact quantities as your numbers compound into the thousands.
If you are past six weeks pregnant, you might even see your test lines become significantly lighter. This is a well-documented chemical glitch known as the hook effect. Your hormone levels become so overwhelmingly high that they flood and break the test strip’s detection mechanisms.
Your daily hydration also dictates the visual outcome. Drinking two extra glasses of water to force a urine sample dilutes your concentration. A perfectly healthy pregnancy will show a lighter line simply because the cup contains more water than hormones.
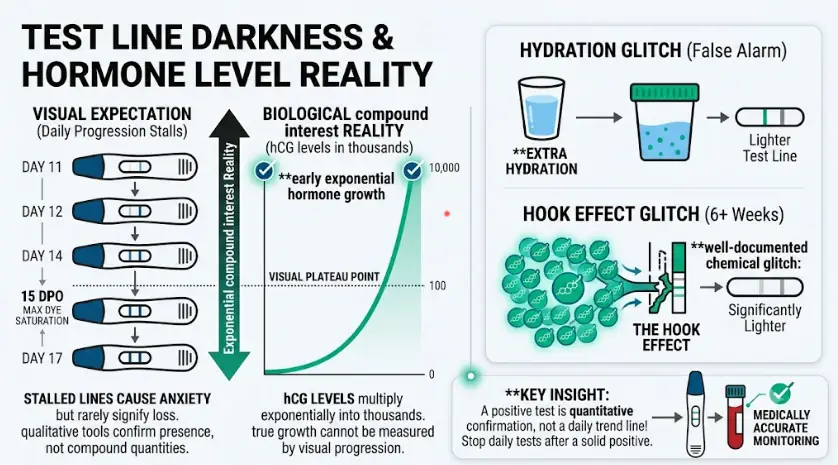
Why this matters
Comparing daily test strips causes unnecessary mental stress and false alarms. Once you achieve a solid positive result, stop taking home tests. A quantitative beta blood draw is the only medically accurate way to monitor your early exponential hormone growth.
Explore More Calculators
Use this fetal growth calculator to check baby weight percentile from ultrasound data in grams, kg, or cm and see what the result means…
Try calculatorEnter gestational sac measurements in mm or cm to calculate mean sac diameter, estimate early gestational age, compare week-by-week milestones, and see when follow-up…
Try calculatorMissed a birth control pill? Check pregnancy risk, protection status, backup contraception needs, and what to do next with our missed pill calculator.
Try calculatorUse our Pregnancy Chance Calculator to estimate your odds. Enter your cycle day, age, and method. Find out if you are in the high-risk…
Try calculatorUse our pregnancy due date calculator to find your exact Baby Due date. IVF, conception, ovulation, and ultrasound methods with weeks and timeline.
Try calculatorUse this Pregnancy Risk Calculator to check age, BMI, health history, bleeding, and twins. See if closer prenatal monitoring may be worth asking about.
Try calculatorHow to Use the Pregnancy Test Line Calculator
This tool matches your physical test strip against clinical hormone data. It estimates your hormone bracket based on visual dye intensity. Follow these five simple steps to run your timeline comparison.
Select Your Tracking Method
Choose between precision tracking or standard weekly tracking. Patients monitoring an embryo transfer should select the exact days past ovulation. Natural conceptions rely on the standard weekly schedule. The algorithm adjusts its baseline depending on your chosen path.
Enter Your Timeline
Type your specific days past ovulation or current pregnancy weeks into the input box. The system uses this exact number to anchor the medical comparison. This ensures the logic evaluates your visual results against the correct developmental milestone.
Move the Visual Slider
Drag the digital marker to match the exact darkness of your physical test strip. Compare the test line directly against the control line. The visual positions range from a very faint shadow all the way to a dark dye stealer.
Run the Analysis
Click the main calculate button to process your entries. The system maps your chosen slider position to an established hormone bracket. It then cross-references this visual estimate against your specific timeline to evaluate the underlying progression speed.
Review Your Progression Status
Check your final assessment badge on the screen. The display reveals your estimated hormone bracket and clinical progression status. It instantly highlights if your visual results are tracking normally, stalling, or triggering a high-level hook effect alert.
How do you check if a light test line is normal nearly three weeks after ovulation?
Let us use a delayed progression scenario to verify the system logic.
Use these inputs in the calculator:
- Tracking Mode: By Days Past Ovulation (DPO)
- Days Past Ovulation: 19
- Line Darkness: Level 2 (Visible but Light)
Process:
The system maps the light visual line to a low hormone bracket. It then checks this low estimate against the advanced 19-day timeline expectation.
Final Result:
- Assessment: Slower Progression.
- Estimated hCG: 40 to 150 mIU/mL.
Meaning:
Your physical line is lighter than expected for this specific date. This result falls below the median standard. It usually prompts a follow-up blood test to check for late implantation or a stalled cycle.
How the Pregnancy Test Line Formula Works (Complete Breakdown)
The pregnancy test line calculator uses a clinical logic matrix instead of a standard math equation. It maps your visual test strip darkness directly to known biological hormone ranges. This system instantly compares your physical chemical reaction against established medical milestones to evaluate your true progression speed.
What is the pregnancy test line progression formula?
The logic formula calculates if your early development is tracking normally by cross-referencing your test strip dye intensity against your exact timeline. It maps a visual slider input to an estimated clinical hormone bracket, then evaluates if that estimated level matches standard milestone expectations for your dates.
					Estimated_hCG = Visual_Slider_Level (1 to 5)
Progression_Status = Clinical_Matrix (Estimated_hCG + Timeline)
This logic matrix translates subjective visual observations into objective clinical data. It assigns a numerical hormone bracket based on how much ink binds to the test strip. The system then cross-references that estimated value with your exact timeline to determine if your body is developing at the expected pace.
Decoding the Progression Variables
Every element inside this system links your home strip appearance directly to clinical milestone charts. These parameters determine your calculated status badge and baseline estimation.
Line Darkness Slider
This input represents the physical chemical reaction on your home test. It ranges from a faint shadow indicating low hormones to a dark dye stealer indicating massive hormone concentration.
Days Past Ovulation (DPO
This metric anchors the exact biological age of your pregnancy. Fertility patients use this precise timeline to check very early developmental milestones against strict medical expectations.
Weeks Pregnant
This tracking method uses the standard calendar timeline starting from your last menstrual period. The algorithm uses these specific weeks to identify advanced pregnancy anomalies like the fading hook effect.
Another Example Calculation (Step-by-Step)
Let us see how the progression logic operates using a standard tracking scenario. This helps you understand how the system maps a physical test band against a later calendar date.
Given:
- Tracking Mode = By Days Past Ovulation (DPO)
- Selected Value = 20 DPO
- Line Darkness Value = Level 2 (Visible but Light)
Calculation:
					Slider Level 2 = 40 to 150 mIU/mL
Timeline Condition = 20 DPO
Logic Trigger = If DPO >= 18 AND Slider <= 2, display "Slower Progression"
Your visual result falls far below the expected median bracket for twenty days past ovulation. A light line is highly unusual at this stage because hormone production should be multiplying rapidly.
Result:
- Calculated Status: Slower Progression
- Estimated hCG Bracket: 40 to 150 mIU/mL
Meaning:
Your physical line is significantly lighter than expected for this specific date. This result falls below the standard clinical median. It usually prompts a follow-up blood test to check for late implantation, diluted urine, or a stalled cycle.
Early Pregnancy hCG Range Chart
While your visual test line provides a great at-home estimate, medical clinics rely on specific quantitative brackets to determine if your early gestation is viable. Below is the standard clinical hCG range chart spanning the critical early weeks:
| Weeks Pregnant (LMP) | Typical Expected hCG Range | Visual Test Strip Appearance |
|---|---|---|
| 3 Weeks | 5 – 50 mIU/mL | Extremely Faint / Shadow |
| 4 Weeks | 5 – 426 mIU/mL | Visible to Medium |
| 5 Weeks | 18 – 7,340 mIU/mL | Darker than Control |
| 6 Weeks | 1,080 – 56,500 mIU/mL | Dye Stealer |
| 7 to 8 Weeks | 7,650 – 229,000 mIU/mL | Dye Stealer (Hook Effect begins) |
Note: Individual hormone baselines vary drastically. Always rely on a 48-hour doubling trend rather than a single static number.
You Might Also Find These Helpful
Pregnancy & Fertility 31
BPD gestational age calculator: estimate fetal age from BPD, compare your week, check normal BPD ranges, and understand ahead or behind results.
Try calculatorCalculate odds with the Chance of Twins Calculator. Enter maternal age and history. Find your probability instantly. See if you will conceive multiples now.
Try calculatorFind out exactly when you conceived. Our free Conception Calculator uses your Due Date, LMP, or Ultrasound to estimate your fertilization date and fertile…
Try calculatorUse our Conception Date Due Date Calculator to find your baby's arrival date. Enter your conception or intercourse date for clinical 40-week results.
Try calculatorContraceptive effectiveness calculator to compare birth control methods, typical vs perfect use, backup protection, and 5-year pregnancy risk.
Try calculatorUse this CRL calculator to estimate gestational age and due date from crown-rump length in mm or cm. Compare CRL, LMP, and IVF dating…
Try calculatorEstimate your monthly and 12-month pregnancy odds by age, partner age, and cycle dates. See your fertile window and when to seek fertility help.
Try calculatorUse this fundal height calculator to compare your cm measurement by week, check growth range, estimate baby weight, and know when to ask about…
Try calculatorPanicking over your hCG levels? Use our hCG 48-Hour Calculator to compare your exact beta rise against the ACOG 35% minimum viability benchmark instantly.
Try calculatorCalculate hCG doubling time instantly. Enter two test results. See if your levels are rising normally. Check pregnancy progress now in the hCG Calculator.
Try calculatorCheck your beta hCG rise with this hCG doubling time calculator. Enter two blood tests to see doubling time, 48-hour increase, and early trend…
Try calculatorConfused by your beta hCG levels? Use our hcg gestational age calculator to estimate your pregnancy weeks, verify IVF dates, and check ultrasound milestones.
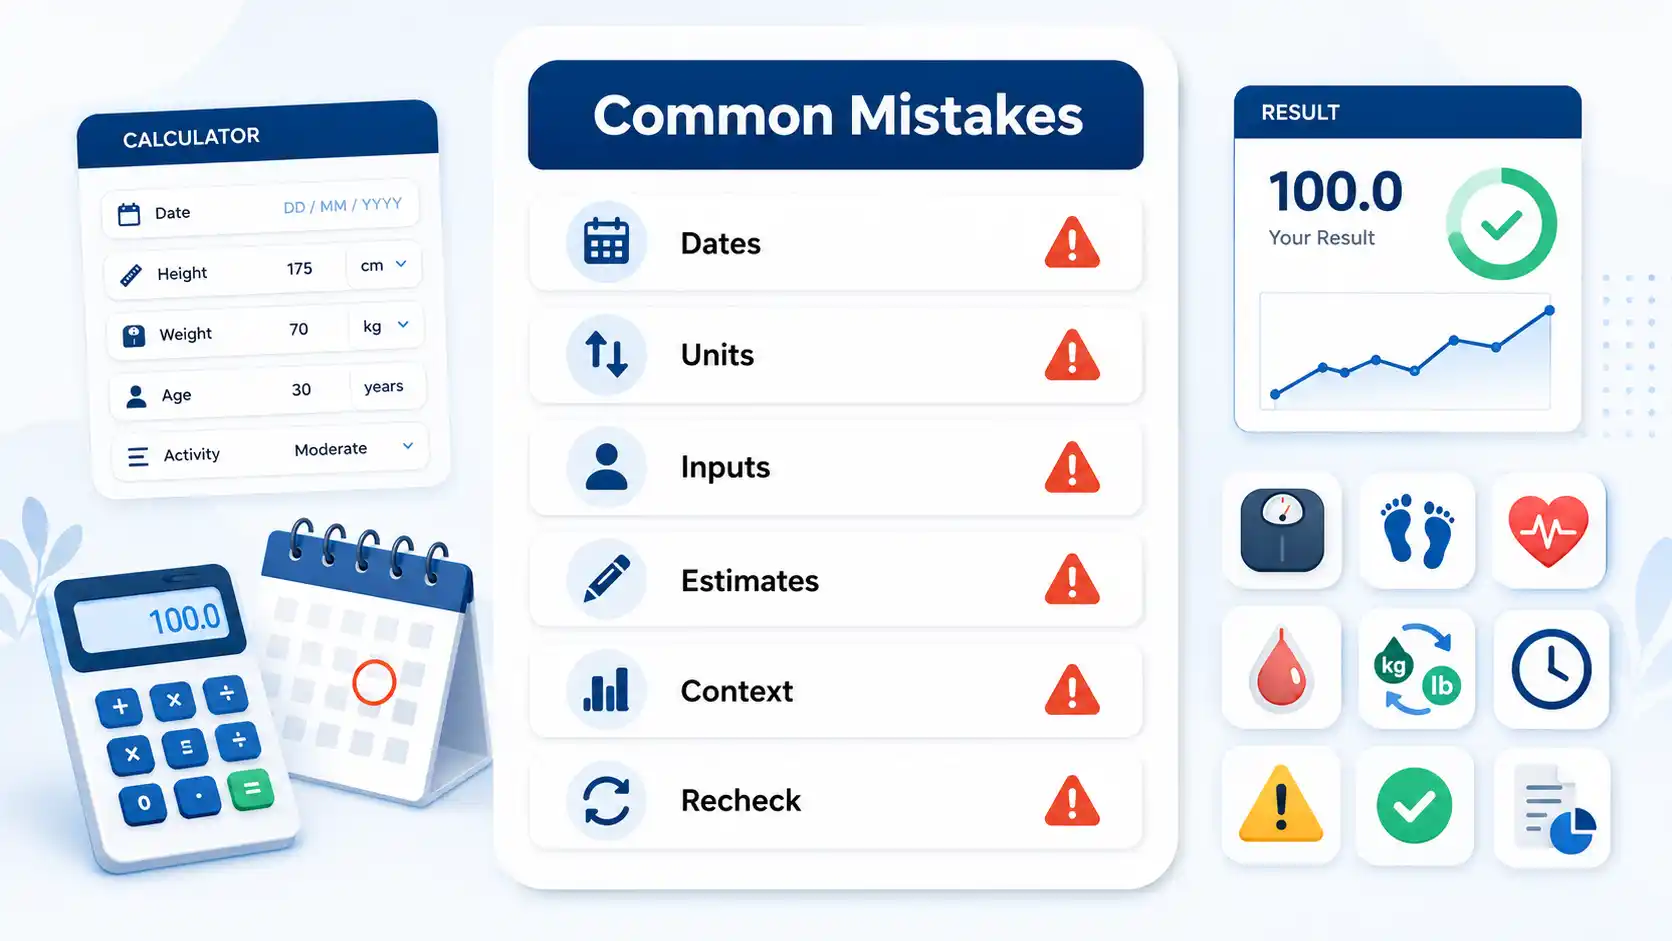
Try calculatorCommon Mistakes When Using the Pregnancy Test Line Calculator
Getting an inaccurate hormone estimate usually happens due to physical testing variables outside the digital tool. Your testing habits directly alter visual strip darkness. Avoiding these standard tracking errors ensures your calculated progression status reflects your actual biological development speed.
- Trusting a single static test line instead of evaluating your progression trend over a full 48 hours.
- Assuming an early rapid dye stealer definitively proves a twin pregnancy without clinical ultrasound confirmation.
- Comparing your daily line darkness across different test brands with varying clinical sensitivity thresholds.
- Panicking over surprisingly faint lines late in the first trimester caused by the hook effect.
- Using highly diluted afternoon urine which produces artificially lighter indicator lines regardless of your actual hormone levels.
Medical Disclaimer
This tool offers educational information only. It is not a substitute for professional medical diagnosis, advice, or treatment. Always consult your doctor or a talented healthcare expert regarding any health concerns. Do not ignore or delay professional medical help based on information or results generated by this site.
Frequently Asked Questions (FAQs)
What is the hook effect on a pregnancy test?
The hook effect happens around eight to ten weeks when massive hormone levels overwhelm the chemical antibodies inside the test strip. This saturation causes a falsely faint or entirely negative visual result despite a perfectly healthy, advanced pregnancy. If you suspect this, diluting your urine with water before testing can sometimes make the line darker.
What does a dye stealer pregnancy test mean?
A dye stealer occurs when your hormone levels are incredibly high and physically pull the chemical ink away from the control strip. The test line becomes drastically darker than the control marker. It indicates a very strong biological hormone presence.
Why did my pregnancy test line get lighter?
A lighter test line early in your cycle often results from highly diluted urine or a potential chemical pregnancy. If you are past eight weeks pregnant, a fading test line is almost always caused by the hook effect overwhelming the test chemistry.
How far apart should the lines be on a pregnancy test?
The physical distance between the test and control lines varies by brand and manufacturer. You should only read the lines within the designated testing window printed on the plastic casing. Reading outside this area often leads to identifying invalid evaporation lines or dye runs.
Does drinking water make a pregnancy test line lighter?
Drinking excess fluids heavily dilutes your urine concentration and will artificially lighten your pregnancy test line. You should always use your first morning urine for tracking progression because it contains the highest overnight concentration of undisturbed hormones.
What does it mean if my pregnancy test line progression stalls?
Stalled visual progression usually means the physical test strip has hit its maximum dye saturation limit. Once the antibodies absorb all available ink, the line cannot get any darker. This frequently occurs around 15 to 17 days past ovulation and is completely normal.
How can I tell an evaporation line from a faint positive?
A true positive line possesses distinct pink or blue dye and appears within the strict five-minute testing window. An evaporation line is a colorless, grayish shadow that forms only after the urine completely dries and the valid timeframe expires.
When should I stop tracking pregnancy test line progression?
You should stop taking home tests once you achieve a solid dye stealer or reach two weeks past your missed period. Physical test strips cannot measure ongoing hormone multiplication effectively. A quantitative beta blood draw provides the only accurate tracking method beyond this point.
What is the normal range of hCG at 4 weeks?
At exactly four weeks pregnant, standard clinical hCG levels range between 5 and 426 mIU/mL. Because this bracket is so wide, a healthy pregnancy at four weeks can display anything from a very faint shadow to a solid medium line on a home test strip.
Questions?
We had love to hear from you! Whether you are reporting an issue, suggesting a new calculator, or exploring collaboration opportunities — we are here to help. Every message helps us make 100calc smarter, faster, and more helpful for everyone.
Why People Trust 100calc
At 100calc.com, we focus on accuracy, speed, and trust. Every calculator we create is designed to give reliable, instant, and easy-to-understand results you can truly depend on.