
Real Estate Appreciation Calculator: Track Compound Growth & True Equity
A real estate appreciation calculator measures the exact compound growth of your property over time. It calculates future residential value, historical growth rates, and commercial forced equity. The engine applies advanced math to track how a home or building increases in worth through local market shifts or direct income improvements.
Most investors look at simple price jumps and think they are getting rich. This is a dangerous illusion. Elevated 2026 inflation silently destroys your buying power. If your house goes up three percent but inflation matches it, your real profit is zero. You must separate fake nominal gains from actual cash value.
This tool tracks your local market data to reveal your true equity. You will forecast future residential wealth and evaluate past property performance. The commercial mode measures forced appreciation based on operating income. Use the inflation toggle to see what your property is actually worth a decade from now.
Quick Facts
- Compound Focus: Calculates exponential growth instead of flat-rate guesses.
- Inflation Reality: Actively subtracts inflation to show true future buying power.
- Commercial Logic: Uses Cap Rates and Net Operating Income for forced appreciation.
- Global Ready: Supports local currencies and exact ZIP code targeting.
- Updated Jun 17, 2026
- Reviewed by 100Calc Research Team
Property Wealth Forecaster
Real Estate Appreciation Calculator
Calculate the true compounding growth of your property. Whether you need an average real estate appreciation calculator for your home, or a commercial real estate appreciation calculator to measure NOI value-add, this tool adjusts for local markets and inflation.
Future Property Value
Total Equity Gained:
The Wealth Composition
How do you calculate the real estate appreciation rate?
How much do homes appreciate in this market?
What is the compound appreciation calculator formula?
Is commercial real estate appreciation calculated differently?
Explore More Calculators
Calculate your exact strike price with our free Maximum Allowable Offer Calculator. Factor in the 70% rule, repairs, and 2026 holding costs fast.
Try calculatorUse our Car Trade-In Tax Savings Calculator to uncover your exact discount instantly. Stop losing money to hidden showroom math and beat private sales.
Try calculatorBuying a family home? Calculate your exact gift of equity to bypass PMI instantly. See your new mortgage payment, tax limits, and get a…
Try calculatorExplore Related Tools
What Your Future Property Value Means
Your result represents the total equity generated by your asset. Nominal numbers often look impressive but they hide the true cost of inflation. The calculator separates your original base value from your actual profit. This gives you a clear picture of your true wealth creation.
Understanding Your Result
The final number shows the projected future price of your property. It highlights exactly how much equity you gained over your holding period. A large future value feels great until you look at the underlying buying power.
The inflation-adjusted number reveals the truth. This metric shows what your future dollars can actually buy in today’s market. Commercial calculations work differently. They show how direct income changes instantly boost the total building value regardless of local housing trends.
Is Your Result Good or Bad?
Historical national averages sit between three and five percent annually. This is a steady result that safely outpaces standard inflation. Growth rates pushing eight percent or higher indicate a hyper-growth market. These high numbers are rare in 2026 and usually happen in gentrifying cities with tight inventory.
A result below three percent is a warning sign. Your property is likely losing real value once you subtract average inflation. Commercial property results depend heavily on your local Cap Rate. A lower Cap Rate makes every new dollar of rental income significantly more valuable.
What You Should Do Next
- Compare your real inflation-adjusted return against other investments. You might discover your cash performs better in a standard index fund.
- Audit your commercial properties for forced appreciation opportunities. Raising rent by a small amount or cutting waste can mathematically force massive new equity.
- Consult a local agent to verify your specific ZIP code growth rate. National averages often fail to predict hyper-local street-by-street demand.
A Quick Example to Test
Imagine you own a residential home worth $400,000. You expect a steady four percent annual growth over 10 years. You enter these numbers along with a realistic three percent inflation rate.
Input:
- Current Value: $400,000
- Holding Period: 10 Years
- Expected Rate: 4%
- Inflation Rate: 3%
Result:
Your future property value reaches $592,097.
Meaning:
You gained $192,097 in raw nominal equity. The inflation toggle shows your real adjusted value is only $440,576. You only gained $40,576 in true buying power over an entire decade. This proves why tracking real wealth is necessary before deciding to hold or sell an asset.
Micro Insight:
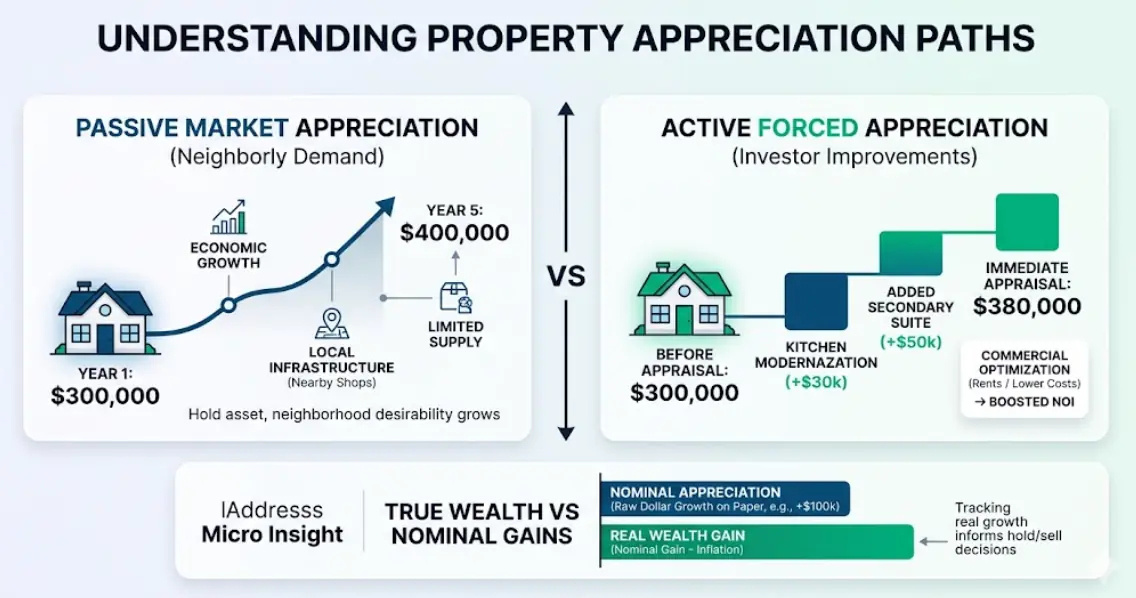
Nominal gains only create true wealth if they outpace inflation. Tracking your real growth helps you decide exactly when to hold or sell a property.
What Is Real Estate Appreciation?
Real estate appreciation is the growth in a property’s market value over time. It builds equity that owners can access by selling or refinancing. This growth happens passively through local market demand. It also occurs actively when an investor improves the property to increase its worth.
Most homeowners experience market appreciation. Economic growth and new local infrastructure make certain zip codes more desirable. A limited supply of homes in popular cities pushes prices higher. You benefit simply by holding the asset while the surrounding neighborhood becomes more valuable.
Forced appreciation works differently. Investors create immediate value by upgrading the property. Adding a secondary suite or modernizing a kitchen directly increases the home appraisal amount. Commercial owners achieve this by raising rents or cutting operational costs. This boosts their net operating income.
Imagine buying a dated cottage for $300,000. Five years later, new shops open nearby. The home value hits $400,000 without any renovations. This gain represents pure market appreciation.
Which Appreciation Method Should You Select?
Residential properties grow passively based on local market demand. Commercial assets grow actively based on the revenue they generate. Choosing the wrong mathematical model guarantees an inaccurate valuation. Select the method that matches your specific property type or investment goal to ensure accurate wealth forecasting.
| Method | Label | USA Guideline | India Guideline | Notes |
|---|---|---|---|---|
| Forecast Value | Residential | Standard for single-family homes and suburban condos. | Used for plot appreciation and tier-1 city flats. | Predicts personal wealth over 10 to 20 years. |
| Historical (CAGR) | Portfolio | Benchmarks home growth against S&P 500 returns. | Evaluates past returns on ancestral land or property. | Checks actual yearly growth of an existing asset. |
| Commercial (NOI) | Income Asset | Primary for multifamily and industrial buildings. | Standard for retail shops and office spaces. | Calculates value based on rental income and cap rates. |
Heads-up: Commercial real estate ignores local residential ZIP code comps. It is valued strictly on its income-producing ability and local Cap Rates.
How to Use the Real Estate Appreciation Calculator
This tool measures exact property wealth generation. It processes local market data to reveal actual compound growth and forced equity. The engine strips away inflation automatically. Here is how the system processes your numbers.
Select Your Calculation Goal
Choose the specific growth model you need. Forecast mode predicts future residential wealth. Historical mode checks past compound annual growth rates. Commercial mode measures forced appreciation using net operating income.
Enter Base Property Values
Input the starting financial numbers for your asset. This requires your current home price or the original purchase amount. Commercial calculations need your exact net operating income instead of a standard appraisal.
Define Your Timeline
Set the exact number of years you plan to hold the property. Compounding mathematics relies heavily on time. The system uses this holding period to calculate exponential growth over flat linear gains.
Set Your Market Rates
Adjust the percentage sliders to match your local economy. You can enter expected annual appreciation, capitalization rates, or historical growth limits. Add your projected inflation rate to see true future buying power.
Review True Wealth
Check the final numbers and the visual ring chart. The system separates your original base value from your actual gained equity. It instantly highlights exactly how much buying power inflation destroys.
How do you calculate a historical property return?
Find your original purchase price and current market value. Compare both numbers using the exact years held to reveal the true annual growth rate. This eliminates the guesswork from past property performance.
Use these inputs in the calculator:
- Original Price: $250,000
- Current Value: $425,000
Years Held: 8.5
Process:
The formula divides the current value by the original price. It then applies the exponent based on your timeline. This finds the exact yearly compound average.
Final Result:
Your Historical Growth Rate is 6.43%.
Meaning:
Your property grew by an average of 6.43 percent every single year. You gained $175,000 in total raw equity over eight and a half years.
Accuracy and Method Behind the Real Estate Appreciation Calculator
Most spreadsheets use flat math that ignores the power of compounding. Our system uses professional growth models to track property wealth across decades. It handles residential market shifts and commercial income valuation with high precision. You get an accurate look at your future buying power by stripping away projected inflation automatically.
Key Features & Benefits
- Uses exact Compound Annual Growth Rate for professional historical accuracy.
- Strips away projected inflation to reveal your true future buying power.
- Separates commercial income models from standard residential comparison data.
- Supports multiple global currencies for international property portfolio tracking.
- Triggers instant status alerts for stagnant markets or depreciating assets.
Technical Process
Input Capture
Records property values and local market rates for precise calculation.
Logic Processing
Applies exponential math to compound your wealth over the timeline.
Value Refinement
Removes inflation costs to show the real cash worth of results.
How the Real Estate Appreciation Formula Works (Complete Breakdown)
Most property spreadsheets use flat straight-line math that ignores the true power of compounding. This real estate appreciation calculator applies professional exponential formulas to track your exact wealth generation over time. It calculates future gains and strips away inflation to reveal your actual buying power.
The Core Appreciation Formulas
					Forecast Compound Value:
Future Value = Current Value * (1 + Rate)^Years

Inflation Adjusted Value (Real Wealth):
Real Value = Future Value / (1 + Inflation Rate)^Years

Commercial Property Value:
Property Value = NOI / Cap Rate
These mathematical models eliminate the emotional guesswork of home pricing. The forecast formula applies year-over-year growth directly on top of your previous gains. The commercial equation skips residential comparison data entirely. It proves that multifamily or retail valuations depend strictly on the income they produce relative to the local market yield.
What Each Variable Means
Every value below connects directly to the inputs in the calculator tool above.
Current Property Value
This is your starting retail price or the current appraisal amount. It acts as the principal base for all future compound gains in the residential forecast model.
Annual Appreciation Rate
This yearly percentage tracks demand in your local market. While national housing data generally targets a three to five percent average, this specific number drives your exponential wealth accumulation.
Holding Period (Years)
This represents the total time you intend to own the asset. The formula applies the growth rate repeatedly over this timeframe. Long hold times maximize your compound equity.
Inflation Rate
This measures the rising cost of living across the 2026 economy. High inflation erodes the buying power of your future dollars. Stripping this away reveals your real wealth gain.
Net Operating Income (NOI)
This is the cash a commercial property earns after operational expenses. Improving this figure mathematically forces your property value higher regardless of local housing trends.
Capitalization (Cap) Rate
This rate reflects the yield investors expect in your city. It determines the valuation multiple for rental buildings. A lower cap rate instantly increases your final property value.
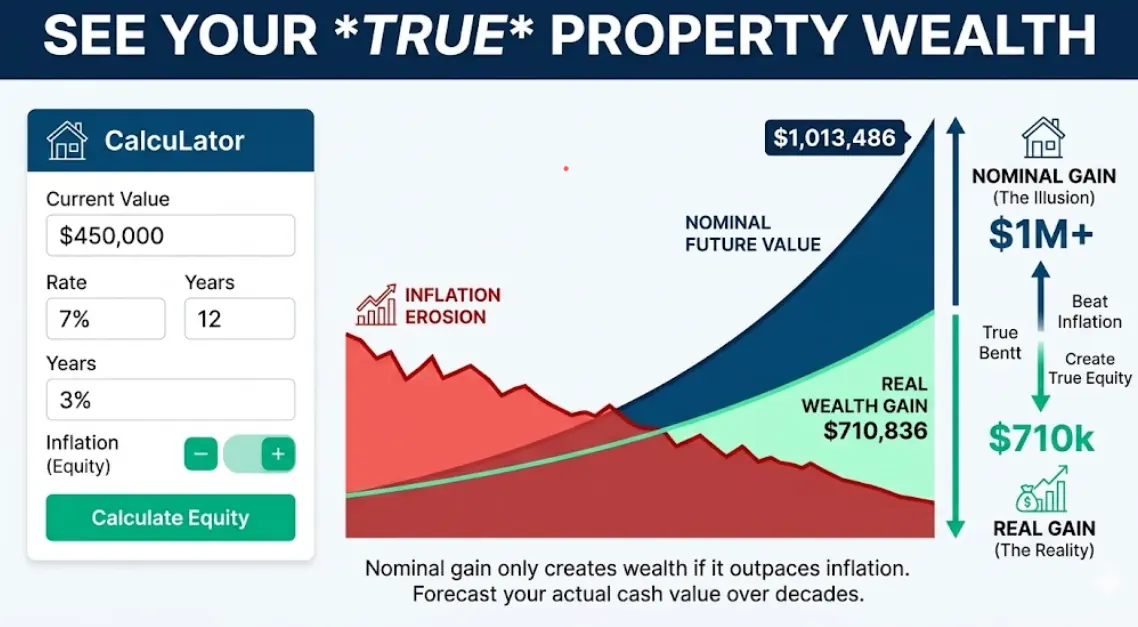
Another Example Calculation (Step-by-Step)
Let’s analyze a high-growth residential rental scenario with an inflation adjustment. This shows how small percentage shifts create massive equity over a decade.
Given:
- Current Value: $450,000
- Growth Rate: 7%
- Inflation Rate: 3%
- Holding Time: 12 Years
Calculation:
					Nominal Future Value:
450,000 * (1 + 0.07)^12 = $1,013,486

Real Inflation-Adjusted Value:
1,013,486 / (1 + 0.03)^12 = $710,836
Result:
- Final Nominal Value: $1,013,486
- Real Adjusted Value: $710,836
Meaning:
Your property price more than doubles on paper. You gained $563,486 in raw equity thanks to a strong seven percent market. However, 2026 economic inflation destroys a massive portion of that cash. Your true buying power only increased by $260,836. This proves why you must calculate real wealth before making long-term investment decisions.
How do you calculate real estate appreciation?
Calculate property appreciation by multiplying your current value by the sum of one plus the annual growth rate, raised to the power of the holding years. For past performance, use the CAGR formula to find the steady yearly increase. Subtract the annual inflation rate to reveal your true wealth gain.
How much will a suburban home be worth in 12 years?
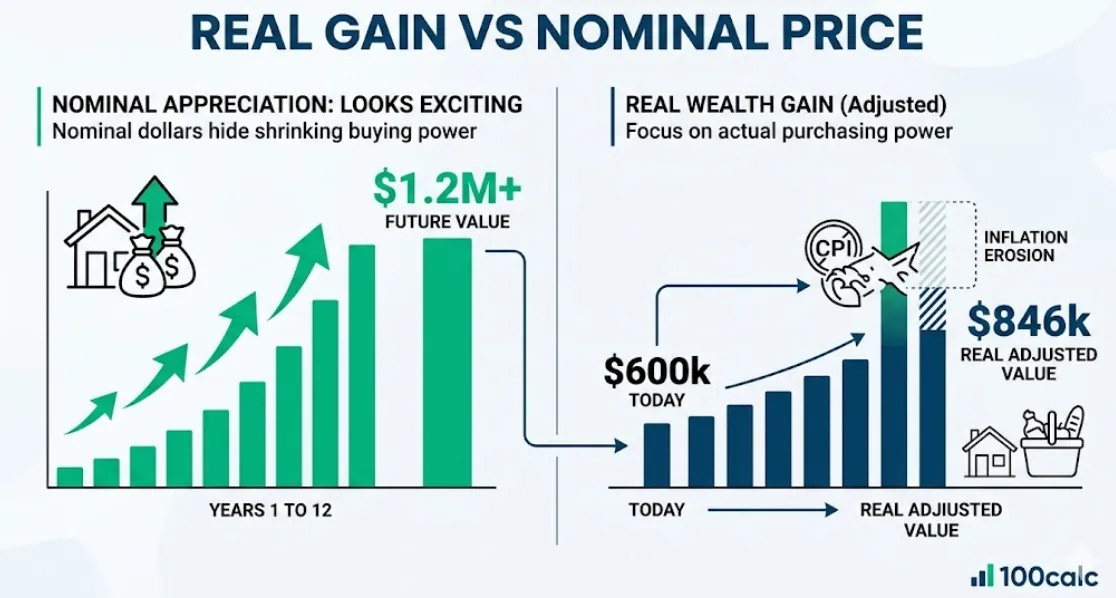
A homeowner in a growing tech hub wants to forecast their future equity.
Input Values:
- Current Value: $600,000
- Holding Period: 12 Years
- Appreciation Rate: 6%
- Inflation Rate: 3%.
Step Explanation:
The system multiplies the $600k base by the six percent compound rate over 12 years. It then divides that future total by the three percent inflation rate.
Final Result:
Future Value is $1,207,318. Real Adjusted Value is $846,793.
Meaning:
Your home price doubles on paper. However, inflation erodes the buying power, leaving you with $246,793 in true wealth gain.
What was the historical growth rate of an inherited family home?
An investor wants to find the exact yearly growth of a property bought decades ago.
Input Values:
- Original Price: $150,000
- Current Market Value: $450,000
- Years Held: 20 Years.
Step Explanation:
The engine uses the CAGR formula to find the steady annual rate required to reach the current price from the original cost.
Final Result:
Historical Growth Rate (CAGR) is 5.65%.
Meaning:
The family property grew by an average of 5.65 percent every single year for two decades.
How does forced appreciation work for a small apartment building?
A commercial investor plans to increase rental income to boost the total building value.
Input Values:
- Current NOI: $40,000
- Projected Future NOI: $55,000
- Market Cap Rate: 6%.
Step Explanation:
The calculator divides the current and future income by the six percent cap rate to show the forced equity shift.
Final Result:
Current Value is $666,667. Future Value is $916,667.
Meaning:
Raising the annual income by $15,000 mathematically forces $250,000 in new property value regardless of the local housing market.
What is the future value of a luxury condo with high inflation?
A buyer wants to see if a luxury unit in a stagnant market still builds wealth.
Input Values:
- Current Value: $900,000
- Holding Period: 5 Years
- Appreciation Rate: 2.5%
- Inflation Rate: 4%.
Step Explanation:
The system calculates the modest growth and compares it against a higher 2026 inflation projection.
Final Result:
Future Value is $1,018,272. Real Adjusted Value is $836,944.
Meaning:
You lose $63,056 in true buying power because the local market growth cannot keep up with rising costs.
Quick rule to remember
Focus on your real wealth gains rather than the total future price. Nominal numbers often hide the fact that your buying power is shrinking. Use your specific local data to see how market shifts affect your equity. Now you can enter your own property details to solve your specific financial problem instantly.
Real Estate Appreciation Result Benchmarks Explained
Your real estate appreciation rate is more than just a percentage. It reveals how fast your property builds actual wealth. Use these benchmark ranges to evaluate your investment performance, compare it against national averages, and decide if you should hold or sell your asset.
| Range | Label | USA Market | Global Trend | Meaning |
|---|---|---|---|---|
| 8% or Higher | Hyper-Growth | Booming tech hubs and gentrifying ZIP codes. | Found in expanding international metro areas. | Hard to sustain over long holding periods. |
| 3% to 5% | Steady Growth | The standard national average for most states. | Matches historical global property trends. | Safe, predictable, and outpaces baseline inflation. |
| Below 3% | Stagnant | Common in slow or declining rural markets. | Barely keeps up with rising living costs. | Your real inflation-adjusted wealth is shrinking. |
| Negative (< 0%) | Depreciating | The local market is actively losing value. | Asset prices drop due to economic shifts. | Property may require massive structural repairs. |
Heads-up: Real estate is hyper-local. A national average might not reflect the actual demand on your specific street.
Interpretation
Maintaining a growth rate between three and five percent is a healthy long-term target. This steady pace builds solid equity and protects your money against inflation. A hyper-growth rate looks great on paper but rarely lasts forever. If your property drops below three percent, your investment is losing actual buying power.
Pro Tip
Always compare your local appreciation rate against current inflation. If inflation runs higher than your property growth, consider selling the asset and moving your cash into a stronger market.
What to Do After Using the Real Estate Appreciation Calculator
Your calculation reveals if your property actually builds wealth. A raw dollar amount means nothing without a solid action plan. Use these next steps to decide whether to hold, sell, or upgrade your asset. Every decision depends heavily on your specific market growth rate and inflation exposure.
For Hyper-Growth Results (8% or Higher)
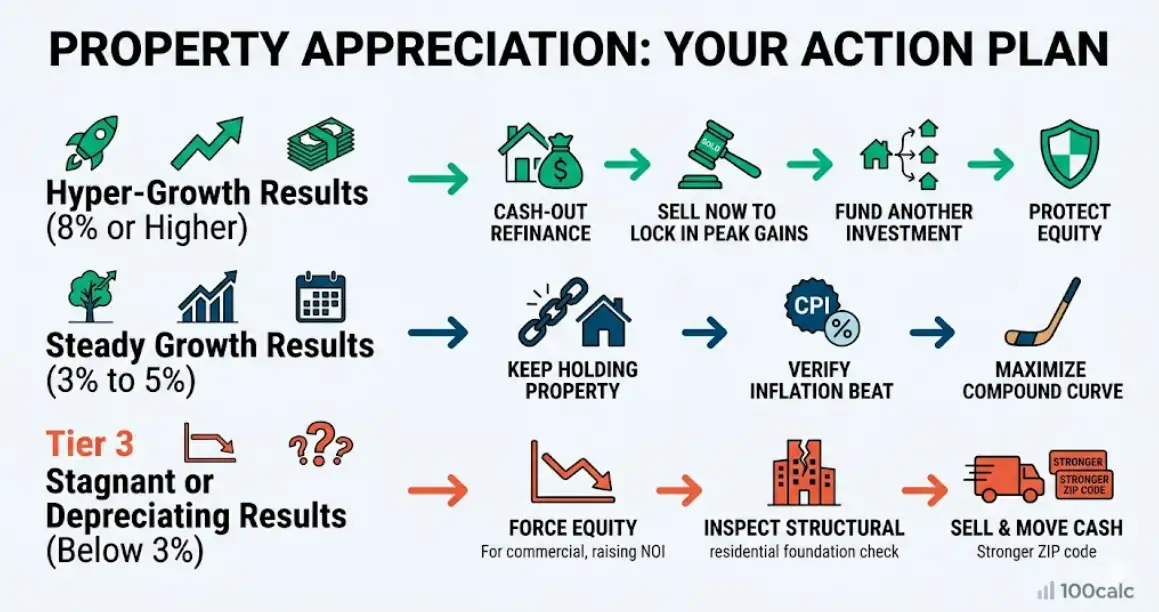
Protect your equity before the market cools down. Booming tech hubs often face sudden oversupply when developers rush to build new units. Consider leveraging your new equity through a cash-out refinance to fund another investment. Selling now might lock in your peak gains before high borrowing costs compress local buyer demand.
For Steady Growth Results (3% to 5%)
Keep holding the property to maximize your compound curve. Financial wealth explodes during the second decade of consistent ownership. Always verify that your steady rate strictly beats the current economic inflation level. Avoid taking on expensive cosmetic renovations in this range, because average markets rarely pay you back full price on luxury upgrades.
For Stagnant or Depreciating Results (Below 3%)
Commercial investors must force immediate equity by cutting operational waste and raising the net operating income. Residential owners should inspect their physical property for hidden structural issues that drag down appraisal values. If local economic factors are permanently declining, selling the asset to move your cash into a stronger ZIP code stops the financial bleeding.
You Might Also Find These Helpful
Real Estate 3
No tools published here yet.
Related Tools People Use Next
Common Mistakes When Using the Real Estate Appreciation Calculator
Inaccurate property estimates often happen when users ignore inflation or mix up valuation models. Relying on national housing averages or basic linear math leads to a false sense of wealth. These errors prevent investors from seeing their true return on investment and available equity.
- Confusing a simple linear interest calculation with the actual exponential compound annual growth rate.
- Assuming expensive cosmetic home renovations guarantee a direct dollar-for-dollar increase in your final market appraisal.
- Applying residential neighborhood comparison math to value an income-producing commercial multifamily property.
- Forgetting to subtract future capital gains taxes and real estate agent commissions from the projected total equity.
- Relying on broad national housing headlines instead of tracking localized street-level ZIP code data trends.
Frequently Asked Questions (FAQs)
How do I calculate property appreciation after renovation?
Renovation return on investment is notoriously difficult to predict and rarely offers a direct cash return. Most cosmetic upgrades return less value than they cost. Unless you fix a severe functional flaw, do not expect renovations to dramatically alter your forecast.
Does Zillow home appreciation calculator account for inflation?
No. Standard online real estate tools only show nominal growth. They project future dollar amounts but ignore the steady loss of purchasing power over time. Our appreciation calculator includes an advanced inflation toggle to reveal your true wealth gain in today’s money.
What is the average real estate appreciation rate by zip code in 2026?
National averages project 1.7 to 3.0 percent growth for 2026. However, real estate remains hyper-local. Certain mid-sized ZIP codes in the Midwest project 7 to 10 percent gains due to tight inventory. Meanwhile, previously hot coastal markets are currently stalling.
Why is commercial real estate appreciation calculated differently?
Residential properties gain value based on nearby neighborhood sales. Commercial properties are valued like active businesses based entirely on the revenue they generate. Increasing a building’s Net Operating Income mathematically forces the property value higher regardless of local housing trends.
Does the land appreciate faster than the physical house?
Yes. Land is a strictly limited resource that consistently gains value as population density increases. The physical house is an aging structure that actually depreciates over time due to wear and tear. Your total appreciation represents the rising land value outpacing the declining building value.
How do capital gains taxes reduce my true appreciation profit?
A standard calculator measures gross equity, not net cash profit. If you sell a non-primary investment property in 2026, the IRS taxes your net capital gains, typically between 15 and 20 percent. You must deduct these taxes, plus closing costs, to find your actual take-home wealth.
How does public transit proximity increase local property values?
New infrastructure development creates localized hyper-growth. Recent 2026 urban data shows properties near newly constructed light rail or major transit hubs can experience a 4 to 8 percent premium in appreciation compared to isolated suburbs. Infrastructure upgrades effectively force equity across an entire neighborhood.
Should I use different appreciation rates for condos versus single-family homes?
Yes. Condominiums typically appreciate slower than single-family houses. Standard homes include exclusive land ownership, which drives faster growth. Condos often carry high monthly HOA fees that reduce future buyer demand. You should generally use a lower annual growth rate for attached units.
How do high 2026 mortgage rates affect my property appreciation forecast?
Mortgage rates forecast near 6.3 percent actively slow down neighborhood appreciation by reducing buyer affordability. High borrowing costs restrict demand, leading to stagnant price growth. You should input a conservative growth rate into the tool during high-rate periods to avoid overestimating future equity.
Where to Find Your Local Appreciation Rate?
National averages are unreliable for exact wealth forecasting. To get the most accurate percentage for your ZIP code, check the FHFA House Price Index (HPI) quarterly reports, pull a Zillow local market report, or ask a local agent for real-time MLS (Multiple Listing Service) data. While a basic home appreciation calculator excel template forces you to use static, outdated national averages, using our dynamic tool allows you to plug in these hyper-local rates and adjust for 2026 inflation instantly.
Questions?
We had love to hear from you! Whether you are reporting an issue, suggesting a new calculator, or exploring collaboration opportunities — we are here to help. Every message helps us make 100calc smarter, faster, and more helpful for everyone.
Why People Trust 100calc
At 100calc.com, we focus on accuracy, speed, and trust. Every calculator we create is designed to give reliable, instant, and easy-to-understand results you can truly depend on.