
Net Operating Profit After Tax Calculator: Expose the True Cash Engine
Net Operating Profit After Tax (NOPAT) is your company’s pure operational profit assuming it holds zero debt. It excludes interest expenses and non-operating income to show exactly what your core business earns. Financial analysts rely on this debt-free metric to calculate Free Cash Flow (FCF) and Return on Invested Capital (ROIC).
Are you still judging business health by standard net income? That bottom-line number often hides the truth. A debt-heavy company might show low net profits despite running a highly efficient operational engine. Conversely, cheap bank financing can easily mask bloated overhead costs and shrinking margins. You cannot make a fair comparison between competing businesses until you separate their core operations from their bank loans.
Enter your income statement data below. This net operating profit after tax calculator rebuilds your financials instantly. You can choose your starting metric based on your available data—EBIT, EBITDA, or standard net income. The system strips away debt distortions, calculates your true operating tax burden, and reveals your Economic Value Added (EVA).
Quick Facts
- Neutralizes Debt Impact:Disregards all interest expenses to evaluate pure, un-levered business operations.
- Solves EBITDA Confusion: Automatically adjusts for depreciation and amortization when calculating from EBITDA.
- ROIC Foundation: Generates the exact numerator required to build advanced corporate valuation models.
- Economic Profit Ready: Computes Economic Value Added (EVA) instantly when your cost of capital is provided.
- Updated Jun 17, 2026
- Reviewed by 100Calc Research Team
Valuation & Profitability Engine
NOPAT Calculator
Determine your Net Operating Profit After Tax to evaluate core business performance. Choose your starting metric below.
Standard Top-Down approach using Operating Income.
Why Calculate NOPAT?
NOPAT isolates a company's performance from its debt structure. It shows what a company earns from its core operations, making it essential for ROIC and EVA.
Net Operating Profit After Tax
The Profit Leak Analysis
Why exclude interest?
NOPAT vs Net Income?
Explore More Calculators
Use this After-Tax Cost of Debt Calculator to find your true effective rate. Factor in corporate tax shields, estimate Bond YTM, and uncover exact…
Try calculatorAre adjusters using flawed reports to lowball your claim? Calculate your true Actual Cash Value (ACV) to expose hidden depreciation and maximize payouts.
Try calculatorStop guessing your hurdle rates. Use this Cost of Equity Calculator to run CAPM or DGM models. Expose hidden market risks and find your…
Try calculatorIs that high-yield dividend stock a trap? Use our Gordon Growth Model calculator to find its exact intrinsic value, set buy prices, and expose…
Try calculatorStandard IRR inflates your profits. Use our MIRR Calculator with WACC to calculate true project returns, safely reinvest cash, and find exact NPV instantly.
Try calculatorAre you growing too fast? Use our sustainable growth rate calculator to find your exact revenue ceiling before a hidden cash deficit ruins your…
Try calculatorExplore Related Tools
What Your NOPAT Result Means
This dollar amount reveals your pure operational efficiency. It shows the exact cash your business model generates before bankers and lenders take their cut. Investors rely on this precise number to compare competing companies that have wildly different debt structures.
Understanding Your Result
Your final output strips away financial noise. Debt and interest payments easily distort standard net income. NOPAT completely removes those borrowing costs from the equation.
This leaves you with the raw earnings power of your core operations. A positive number proves your underlying business works. It confirms your daily operations generate real cash after covering necessary operating taxes.
Is Your Result Good or Bad?
A good result depends heavily on your invested capital. You have a Value Creating business if your profit generates a positive Economic Value Added (EVA). This means your operations earn higher returns than your borrowing costs. You are building actual wealth.
You show High Margin Efficiency if your business converts a massive percentage of its revenue directly into unlevered cash. A bad result occurs when your core profits fail to cover your weighted average cost of capital. Your business destroys wealth even if the bottom line shows a profit.
What You Should Do Next
- Compare your unlevered profit against main competitors to judge your true market strength.
- Calculate your Return on Invested Capital (ROIC) using this exact number as your numerator.
- Review your operating expenses immediately if revenue is high but core profit remains low.
- Track your Economic Value Added to ensure your daily operations actually build company wealth.
A Quick Example to Test
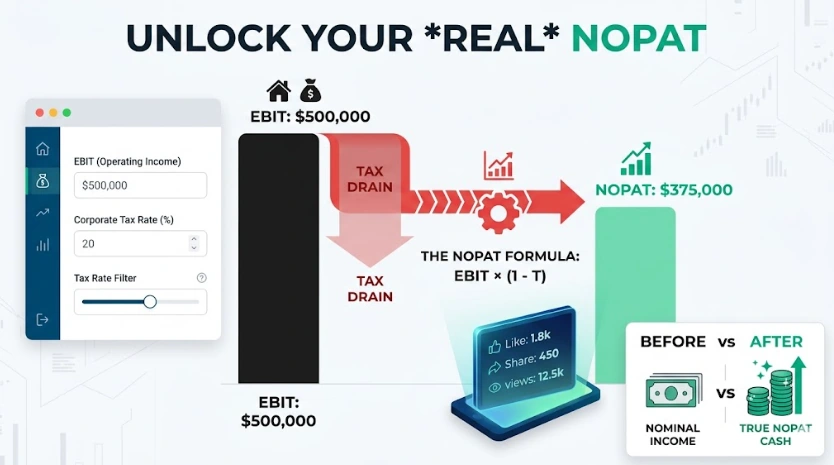
Let us evaluate a regional logistics company using the standard EBIT method. Add these numbers into the tool to see the valuation engine in action.
Input:
- Method: From EBIT
- Operating Income: $800,000
- Tax Factor: 25%
- Capital: $2,000,000
- WACC: 12%
Result:
- NOPAT: $600,000
- Economic Value Added (EVA): $360,000
Meaning:
The logistics company generates a strong operational profit of $600,000. This highly efficient core engine easily covers the $240,000 internal cost of capital. The business creates $360,000 in true economic wealth for its investors.
Which Starting Metric Should You Use?
You can calculate unlevered profit from the top down or the bottom up. Your choice depends entirely on your current income statement structure. Select the correct starting metric below to ensure your final corporate profit matches standard financial modeling rules.
| Starting Metric | Method Type | How It Works | Best Industry Fit | Notes |
|---|---|---|---|---|
| From EBIT | Top-Down | Multiplies operating income by your after-tax rate. | Standard corporate valuation and software firms. | Fastest and most common baseline. |
| From EBITDA | Asset-Heavy | Subtracts depreciation first, then applies your tax rate. | Real estate, manufacturing, and heavy logistics. | Adjusts for massive asset wear. |
| From Net Income | Bottom-Up | Adds tax-adjusted interest back to your bottom line. | Highly leveraged businesses or buyout targets. | Reverses complex debt structures. |
Heads-up: Start with EBIT if you have clear operating profit numbers. It remains the most widely accepted professional standard for quick analysis.
How to Use the Net Operating Profit After Tax Calculator
This calculator strips away debt-related distortions to reveal the core profitability of your business. It rebuilds your income statement from EBIT, EBITDA, or Net Income to show what your operations truly earn after taxes. Follow these simple actions to evaluate your operational engine instantly.
Select your starting metric
Choose the metric that matches your available financial statement data. The top-down EBIT method works best for standard operating analysis. Use the EBITDA method if your business has heavy depreciation. The Net Income method works best for bottom-up analysis starting from your bottom-line profit.
Enter your core profit figure
Input the exact dollar amount from your chosen metric. Use your Operating Income for the EBIT method, or your EBITDA for the second approach. If you start with Net Income, enter your bottom-line profit. Ensure all figures match your most recent annual or quarterly earnings report.
Apply tax adjustments
Enter your tax rate as a flat percentage or the total dollar amount paid on operating income. If using the Net Income method, provide your interest expense so the system can calculate the tax-shield adjustment. This accurately isolates the tax burden specifically linked to your core operations.
Input revenue for margin analysis
Add your total annual revenue to calculate your NOPAT margin. This step is optional but provides a clear view of your operational efficiency. It shows exactly how many cents of every dollar in sales you actually retain as unlevered profit after paying operating taxes.
Calculate and review wealth creation
Enter your invested capital and WACC to reveal your Economic Value Added (EVA). The calculator instantly shows your debt-free profit and checks if your business creates wealth. This confirms whether your daily operations earn more than the cost of funding your assets.
Test the calculator using a fresh business case to see the math in action.
Use these inputs in the calculator:
- Method: From Net Income
- Net Income: $300,000
- Interest Expense: $60,000
- Tax Factor: 20%
Process:
The system adjusts your interest expense for the tax shield. It adds this tax-adjusted interest back to your Net Income. This process creates a clean profit figure that ignores how your business is funded.
Final Result:
- NOPAT: $348,000
Meaning:
Your core operations generated $348,000 in unlevered cash. This result shows the true earning power of your business model, regardless of your current bank debt or financing choices.
Accuracy Behind the Net Operating Profit After Tax Calculator
This valuation engine uses institutional-grade corporate finance logic to process your financial metrics. It separates your operational performance from your capital structure by running unlevered data audits. This backend system completely removes financing noise to ensure your net operating profit after tax calculator outputs are highly accurate.
Key Features & Benefits
- Instantly isolates your core operational profitability from complex corporate debt structures.
- Adjusts interest expenses for tax shields automatically using a bottom-up parsing system.
- Estimates exact operational tax liabilities entirely independent of your financing decisions.
- Computes real-time Economic Value Added metrics to verify corporate wealth creation.
- Supports swift, dynamic switching between flat dollar and percentage-based tax inputs.
Technical Process
Data Input
Captures your core accounting entries and validates financial figures based on your top-down or bottom-up accounting selection.
Logic Processing
Applies dual-rate tax matching parameters to separate financing choices from your core operational performance.
Output Generation
Displays your accurate unlevered profit alongside operational margins and real economic value metrics instantly.
Micro Insight:
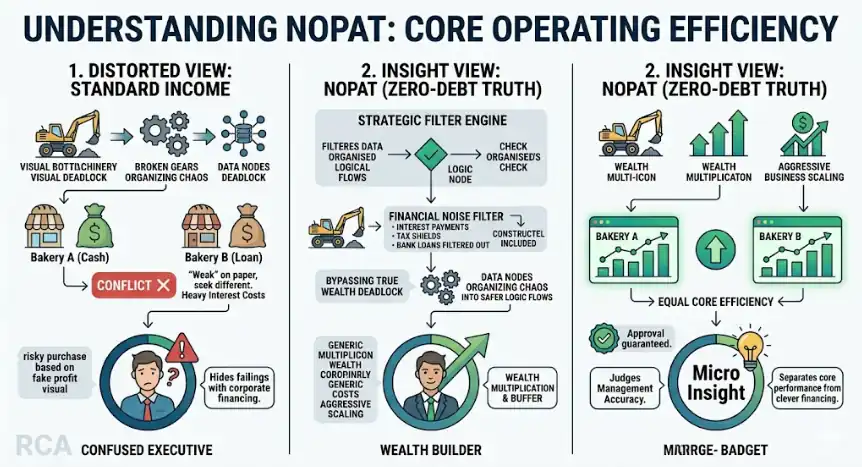
Investors use this unlevered profit to judge management teams accurately. Buying a business based on standard net income carries massive risk. A failing core operation can easily hide behind clever corporate financing.
What is Net Operating Profit After Tax?
Net Operating Profit After Tax (NOPAT) is the total cash a company earns from core operations if it had zero debt. It measures pure business efficiency. This metric removes the financial noise caused by bank loans, interest payments, and tax shields to reveal true operating performance.
Think of two bakeries selling the exact same amount of bread. Bakery A paid for its ovens with cash. Bakery B took out a massive bank loan to fund its startup costs.
On a standard income statement, Bakery A looks highly profitable. It has no debt payments draining its cash. Heavy interest costs make Bakery B look incredibly weak on paper.
NOPAT fixes this distortion. It completely ignores how the bakeries funded their equipment. The metric only calculates how well they bake and sell bread. This proves which location actually runs a stronger daily operation.
How the Net Operating Profit After Tax Formula Works (Complete Breakdown)
This net operating profit after tax calculator uses dual formulas to isolate your core operational cash flow. It calculates the exact amount of money your business earns by removing debt distortions. The system uses a top-down or bottom-up approach to ensure your results remain completely capital structure-neutral.
What is the net operating profit after tax formula?
The formula calculates your un-levered corporate profit by adjusting standard income statement figures. The top-down method multiplies your operating profit (EBIT) by your after-tax retention rate. The bottom-up method adds your tax-adjusted interest expense back into your final net income. Both approaches remove the financial impact of your debt to find true operational efficiency.
Formula:
Top-Down Method (From EBIT):
NOPAT = EBIT × (1 - Tax Rate)
Top-Down Method (From EBITDA):
NOPAT = (EBITDA - Depreciation & Amortization) × (1 - Tax Rate)
Bottom-Up Method (From Net Income):
NOPAT = Net Income + [Interest Expense × (1 - Tax Rate)]
This mathematical structure calculates the pure cash generated by your day-to-day business activities. The top-down approach applies your effective tax rate directly to your operating income. The bottom-up method takes your final net income and adds back the tax-adjusted interest you paid to banks. Both formulas bypass financing choices to deliver an accurate, unlevered performance metric.
What Each Variable Means
Each value below connects directly to your calculator inputs. These specific numbers determine the true economic profitability of your operations.
EBIT (Earnings Before Interest and Taxes)
This is your total operating profit. It represents the money generated from core business activities before you pay lenders or settle obligations with the government.
Tax Rate
This represents your effective corporate tax rate, expressed as a decimal or percentage. It determines exactly how much of your operating profit must go to taxes.
Net Income
This is your absolute bottom-line profit. It shows the final cash remaining after you have paid all operating expenses, taxes, and interest obligations for the year.
Interest Expense
This is the total cost of borrowing money. The system uses this to calculate your interest tax shield and add those financing costs back into your core profit.
Depreciation & Amortization
This non-cash expense accounts for the gradual loss of value in your equipment, facilities, or intangible assets over time. You must subtract this from EBITDA before applying your tax rate.
Another Example Calculation (Step-by-Step)
Let us test a fresh case using the bottom-up method for a regional logistics company. This example demonstrates how standard net income completely hides true operational performance.
Given:
- Net Income = $400,000
- Interest Expense = $100,000
- Tax Rate = 20%
Calculation:
Tax-Adjusted Interest = $100,000 × (1 - 0.20)
Tax-Adjusted Interest = $100,000 × 0.80 = $80,000
NOPAT = $400,000 + $80,000
NOPAT = $480,000
Result:
- Calculated NOPAT: $480,000
Meaning:
The logistics company actually generated a robust $480,000 from its core operations. Because the business carried heavy debt, its standard net income of $400,000 masked its true operational efficiency. This debt-free calculation proves the underlying business model is significantly stronger than the final bottom line suggests.
How do you calculate net operating profit after tax?
Calculate your pure operational profit by adjusting standard income statement figures. Multiply your operating income (EBIT) by your after-tax rate. Alternatively, add your tax-adjusted interest expense back to your final net income. This reveals the actual cash your business generates before accounting for debt financing.
How do you calculate NOPAT from an income statement?
A tech hardware firm wants to find its core operational profitability directly from its latest P&L statement.
Use these inputs in the calculator:
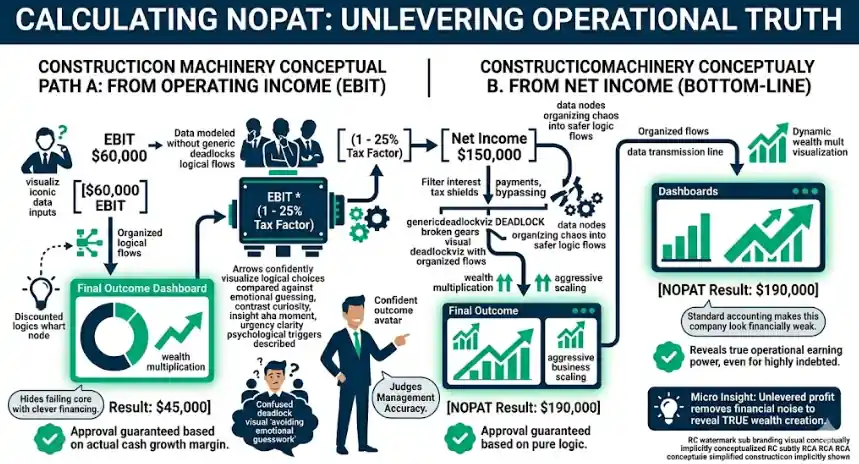
- Operating Income (EBIT): $60,000
- Tax Factor: 25%
Process:
The firm multiplies its $60,000 operating income by the 75% after-tax retention rate.
Result:
- NOPAT: $45,000
Meaning:
The core business generates $45,000 in unlevered cash. This shows true earning power regardless of how the firm financed its servers or factory equipment.
How do you calculate NOPAT margin?
A retail chain wants to see exactly how much of every sales dollar it retains as debt-free profit.
Use these inputs in the calculator:
- Method: From EBIT
- Operating Income: $1,000,000
- Tax Factor: 30%
- Total Revenue: $5,000,000
Process:
The calculator first determines the NOPAT by applying the tax rate. It then divides that $700,000 core profit by the $5,000,000 total revenue.
Result:
- NOPAT: $700,000
- NOPAT Margin: 14%
Meaning:
The retail chain retains exactly 14 cents of unlevered cash for every dollar in sales. This percentage provides a clear benchmark to compare operational efficiency against industry competitors.
How do you calculate NOPAT from net income?
A heavily indebted manufacturing company needs to find its core profit starting from its bottom-line earnings.
Use these inputs in the calculator:
- Method: From Net Income
- Net Income: $150,000
- Interest Expense: $50,000
- Tax Factor: 20%
Process:
The system calculates the tax-adjusted interest by multiplying the $50,000 expense by the 80% retention rate. It then adds this $40,000 tax shield back to the $150,000 net income.
Result:
NOPAT: $190,000
Meaning:
Standard accounting makes this company look financially weak. The $190,000 debt-free profit proves the operational engine runs well, but massive bank loans are dragging down the final bottom line.
Quick rule to remember
Look strictly at operations, not debt. Standard net income includes your financing choices, which easily skews business comparisons. Always strip out interest expenses to measure your pure business performance. Once you understand that baseline, enter your own accounting numbers above to evaluate your true wealth creation.
NOPAT and EVA Result Benchmarks Explained
Your calculated profit tells only part of the story. You must compare your core earnings against your capital costs to see if you actually create wealth. Use these benchmarks to evaluate your financial standing and make clear corporate funding decisions.
| EVA Range | Status | Financial Meaning | Corporate Impact | Recommended Action |
|---|---|---|---|---|
| EVA > $0 | Value Creating | Returns safely exceed capital costs. | Builds measurable corporate wealth. | Expand operations or approve funding. |
| EVA = $0 | Break-Even | Profits exactly match funding costs. | Generates zero additional wealth. | Review strategy for efficiency gains. |
| EVA < $0 | Value Destroying | Operations fail to cover capital costs. | Actively drains company resources. | Restructure or reject the project. |
Heads-up: A highly leveraged company can show positive net income while actively destroying economic value. Always rely on EVA for final funding decisions.
Interpretation
A positive Economic Value Added proves your business model works. It means your core operations generate enough cash to satisfy lenders and reward shareholders. Falling below zero acts as a massive financial warning sign. Even if your net income looks healthy on paper, a negative economic value means your daily operations are bleeding the company dry.
Pro Tip:
Always use a realistic Weighted Average Cost of Capital (WACC) when testing your metrics. Underestimating your borrowing costs will artificially inflate your results and trick you into approving bad investments.
How to Improve Your Net Operating Profit After Tax Result
Your calculated profit represents just the starting point. The real value comes from using this debt-free baseline to drive corporate decisions. Financial managers rely on these exact numbers to uncover operational bloat, adjust product pricing, and allocate capital efficiently. Stop guessing and let the data guide your next move.
Actions for Value Creating Results
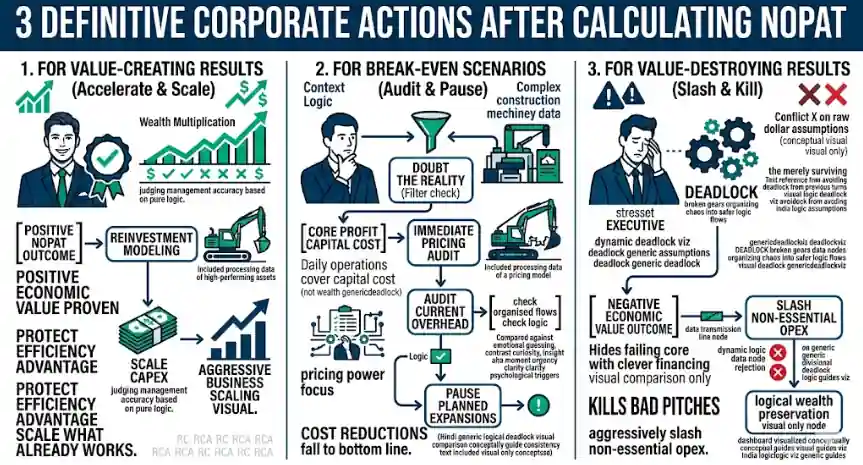
A positive economic value confirms your core operations run highly efficiently. Protect this advantage by reinvesting free cash flow back into your highest-performing assets. Compare your unlevered margin against direct competitors to see if you can safely capture more market share. If your operational margin leads the industry, avoid risky new product lines that might dilute this core efficiency. Keep capital expenditures focused strictly on scaling what already works well.
Steps for Break-Even Results
Hitting a break-even metric means your daily operations merely cover your cost of capital. You are not building actual corporate wealth yet. Focus immediately on pricing power and minor cost reductions. Small price increases fall directly to your bottom line when fixed costs remain stable. Audit your current overhead expenses closely. Pause any planned expansions until your core profit margin safely clears your current borrowing rate.
Tactics for Value Destroying Results
A negative economic value demands rapid intervention. Your business is burning cash on an operational level before bankers even collect their interest payments. Stop looking at standard net income entirely. You must aggressively slash non-essential operating expenses right now. Review every vendor contract and shut down underperforming company divisions. Do not approve new capital projects until your core production engine proves it can actually generate positive un-levered cash flow.
You Might Also Find These Helpful
Corporate Finance 6
No tools published here yet.
Related Tools People Use Next
Common Mistakes When Calculating Net Operating Profit After Tax
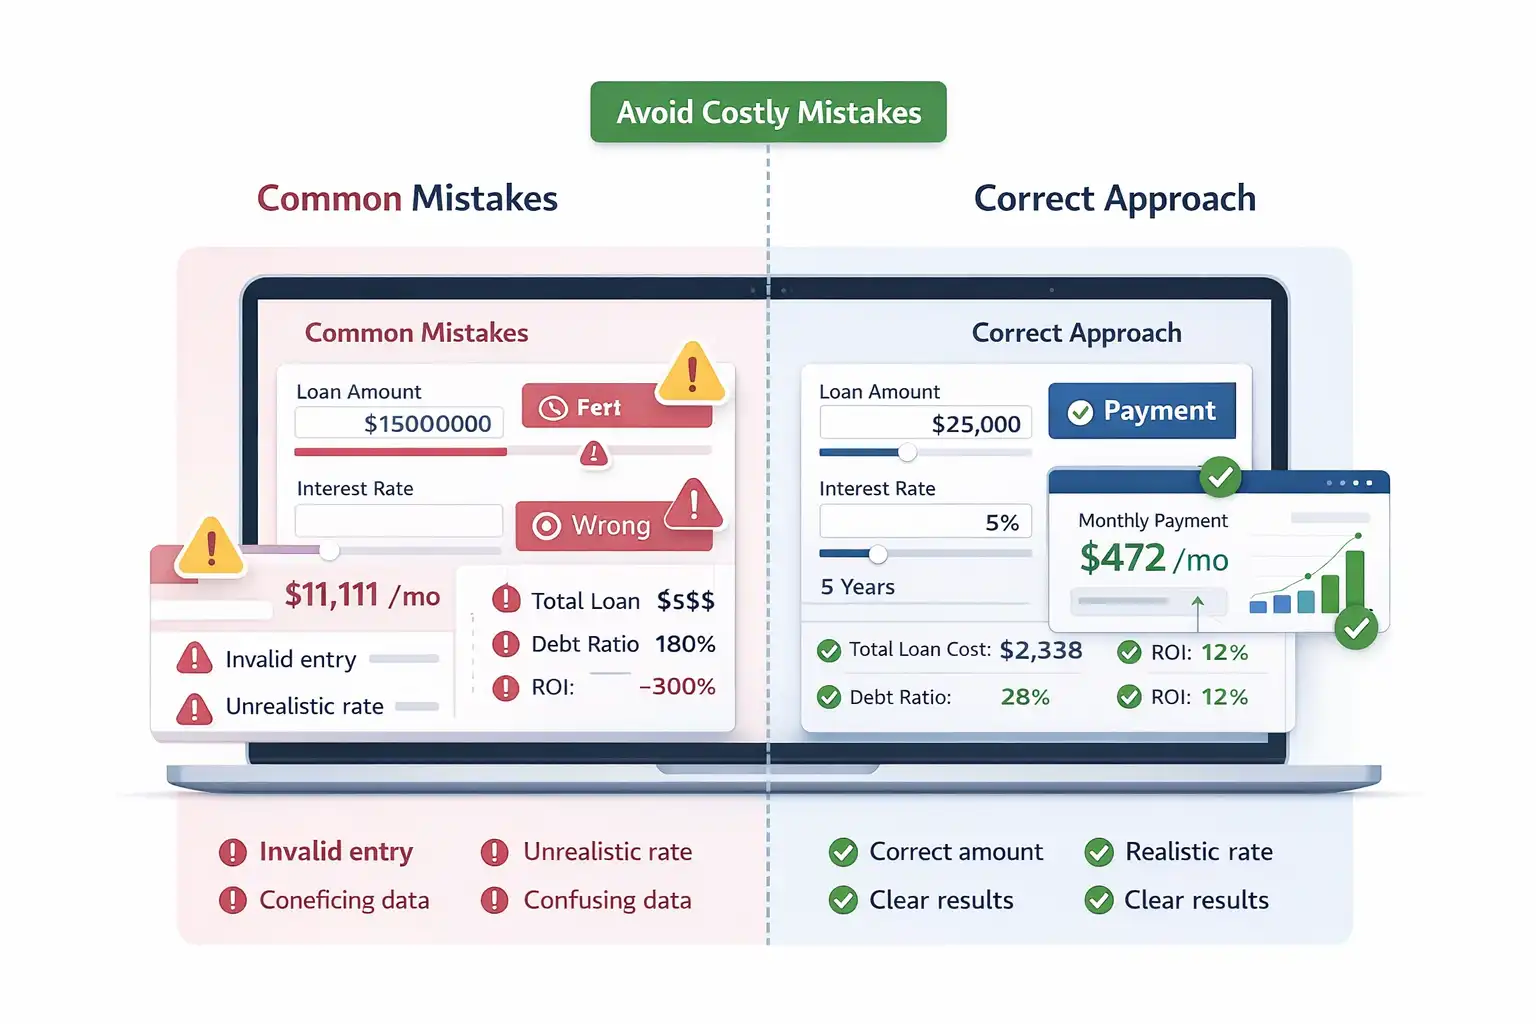
Financial analysts frequently miscalculate unlevered earnings by bringing non-core or debt-related noise into the equation. Entering skewed data into your valuation model completely invalidates your economic profit metrics. Avoid these frequent accounting errors to ensure your operational cash flow results remain perfectly accurate.
- Confusing standard net income directly with unlevered profit without removing the debt distortions.
- Forgetting to tax-adjust your interest expense when rebuilding the statement from the bottom up.
- Using theoretical statutory tax rates instead of the company's actual effective tax rate.
- Including one-time, non-operating income like property sales in the core EBIT calculation.
- Ignoring necessary depreciation and amortization deductions when starting the calculation from EBITDA.
Frequently Asked Questions (FAQs)
How do you calculate NOPAT from the income statement?
Find your Operating Income (EBIT) on the income statement. Multiply that number by one minus your effective tax rate. This simple top-down approach instantly removes the impact of your debt structure. It shows exactly how much your core operations earned.
NOPAT vs. Net Income: What is the main difference?
Net Income includes your interest payments and debt obligations. NOPAT completely ignores debt. It shows exactly how much profit your business operations generate before bankers take their interest cut. This allows for fair comparisons between companies with different debt levels.
Does NOPAT include interest expense?
No. The entire purpose of this metric is to exclude interest. If you start your calculation from Net Income, you must mathematically add the tax-adjusted interest back into the total. This removes the financial distortion caused by corporate borrowing.
Is NOPAT the same as EBIT after tax?
Yes. Financial analysts often use the terms interchangeably. Multiplying Earnings Before Interest and Taxes (EBIT) by one minus your corporate tax rate yields your precise Net Operating Profit After Tax. Both terms represent your unlevered operational cash engine.
How do you calculate Free Cash Flow (FCFF) from NOPAT?
Start with your unlevered profit. Add back non-cash expenses like depreciation and amortization. Then, subtract any changes in your net working capital and your total capital expenditures for the year. This reveals the actual cash available to all investors.
How do you calculate the NOPAT margin?
Divide your final debt-free profit by your total annual revenue, then multiply by 100. This percentage reveals exactly how many cents of unlevered profit you keep from every dollar in sales. It helps benchmark operational efficiency against industry competitors.
Does this calculation include depreciation and amortization?
Yes, but only as a deducted operating expense. Standard operating profit already subtracts depreciation to account for asset wear. If you calculate your profit starting from EBITDA, you must manually deduct these non-cash expenses before applying your corporate tax rate.
What is the difference between operating profit and NOPAT?
Operating profit shows what your business earns from its core operations before paying any taxes or interest. NOPAT takes that exact same number and subtracts your estimated operating taxes. Operating profit is pre-tax, while this un-levered metric reflects your after-tax reality.
Why do analysts use NOPAT for Economic Value Added (EVA)?
EVA measures true wealth creation by comparing core profits against the cost of capital. Un-levered profit provides the perfect capital-neutral baseline for this equation. You subtract your total capital costs from this baseline to see if operations actually build wealth.
Does NOPAT account for one-time business expenses?
No. You must manually exclude non-recurring events like real estate sales, lawsuit settlements, or restructuring costs from your operating income. Removing these unusual items ensures your final calculation reflects the true, sustainable baseline of your daily business operations.
How do you calculate Net Operating Assets (NOA) to use with NOPAT?
Subtract your total operating liabilities from your total operating assets. You must strictly ignore all financial assets and financial liabilities during this step. Analysts divide their un-levered profit by NOA to find the return on net operating assets.
Can a business have a negative net operating profit after tax?
Yes. A negative result means your core operations lose money before you even pay your lenders. This indicates severe structural inefficiency. Management must rapidly reduce overhead costs or increase product prices to stop the cash bleed and survive.
How do you calculate tax on operating profit?
Multiply your core operating income by your effective corporate tax rate. Do not use your standard tax provision from the bottom of your income statement. That standard number is heavily skewed by the interest tax shield created by corporate debt.
What is the difference between NOPAT and NOPBT?
NOPBT stands for Net Operating Profit Before Tax, which is simply another name for your standard operating income. Subtracting your estimated operating taxes from your NOPBT gives you your final after-tax operational profit.
Is NOPAT a required GAAP accounting metric?
No. Generally Accepted Accounting Principles do not require companies to report this specific number on official filings. It is a non-GAAP valuation metric created by financial analysts to evaluate economic reality rather than strict accounting rules.
What is the interest tax shield in the NOPAT calculation?
Corporate debt creates an interest tax shield because interest payments are tax-deductible. This artificially lowers a company’s tax bill. When calculating from Net Income, you must add back your tax-adjusted interest to remove this shield and reveal your capital-structure neutral profit.
How do you calculate NOPAT from gross profit or revenue?
You must calculate your operating income first. Subtract your Cost of Goods Sold (COGS) and daily Operating Expenses (OpEx) from your total revenue to find your EBIT. Once you have EBIT, multiply it by your after-tax retention rate.
Questions?
We had love to hear from you! Whether you are reporting an issue, suggesting a new calculator, or exploring collaboration opportunities — we are here to help. Every message helps us make 100calc smarter, faster, and more helpful for everyone.
Why People Trust 100calc
At 100calc.com, we focus on accuracy, speed, and trust. Every calculator we create is designed to give reliable, instant, and easy-to-understand results you can truly depend on.