
MIRR Calculator with WACC: The Capital Budgeting Reality Check
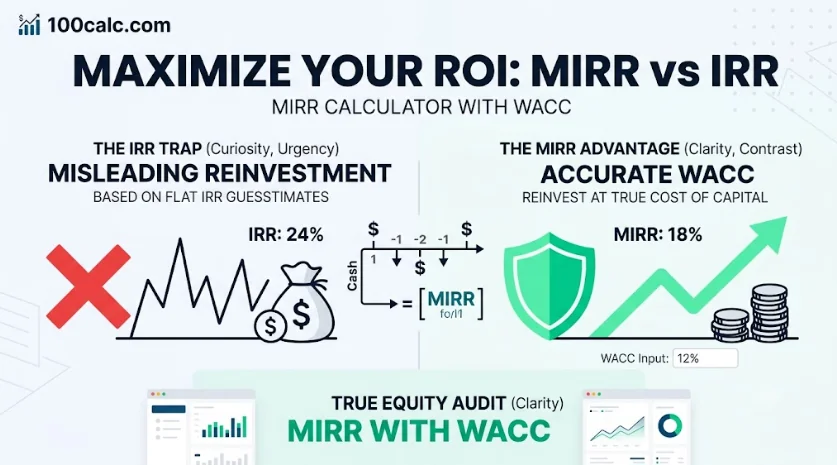
The Modified Internal Rate of Return (MIRR) measures your true project profitability. Standard IRR assumes you reinvest profits at the project’s own high return rate. This creates dangerously inflated numbers. This MIRR calculator with WACC fixes that mathematical flaw. It discounts your project costs using your actual finance rate. It then compounds your future profits at a safe, realistic reinvestment yield.
Are you still pitching investments using standard IRR? That metric is likely lying to you. Finance professionals know standard IRR mathematically overstates returns. Nobody can guarantee constant, high-yield reinvestments on every dollar earned. Relying on those optimistic numbers puts your entire capital budget at risk.
Enter your project cash flows, finance rate, and reinvestment yield below. The system calculates your true return percentage and exact Net Present Value (NPV) instantly. You will see immediately if your project creates real wealth or destroys company capital.
Quick Facts
- Fixes Multiple IRR: Solves the math crash caused by alternating cash flows.
- Excel Aligned: Uses the standard Combination approach found in financial models.
- Visual Reality Check: Charts your realistic MIRR directly against the inflated IRR.
- 3 Academic Approaches: Supports Combination, Discounting, and Reinvestment methods.
- Updated Jun 17, 2026
- Reviewed by 100Calc Research Team
Capital Budgeting Decision Engine
MIRR Calculator with WACC
Evaluate project profitability with the Modified Internal Rate of Return (MIRR). Calculate your project's true potential, find the Net Present Value (NPV), and get a reality check against standard IRR.
The standard Combination approach (used by Excel) discounts negative flows to Year 0 and compounds positive flows to the final year.
Why use MIRR over Standard IRR?
Standard IRR assumes you reinvest project profits at the project's own high return rate—which is often unrealistic. MIRR fixes this flaw by assuming profits are reinvested at your actual, realistic reinvestment rate.
Modified Internal Rate of Return
%
Your project evaluation will appear here.
The Reality Check: MIRR vs IRR
Compare your realistic MIRR against your WACC hurdle rate and the inflated standard IRR.
Calculation Summary
A direct mathematical summary based on your selected academic approach will appear here.
Why is my MIRR different from the standard IRR?
Your dynamic reality-check explanation will appear here after calculation.
Should I accept this project based on these results?
Your dynamic capital budgeting decision recommendation will appear here.
Explore More Calculators
Use this After-Tax Cost of Debt Calculator to find your true effective rate. Factor in corporate tax shields, estimate Bond YTM, and uncover exact…
Try calculatorAre adjusters using flawed reports to lowball your claim? Calculate your true Actual Cash Value (ACV) to expose hidden depreciation and maximize payouts.
Try calculatorStop guessing your hurdle rates. Use this Cost of Equity Calculator to run CAPM or DGM models. Expose hidden market risks and find your…
Try calculatorIs that high-yield dividend stock a trap? Use our Gordon Growth Model calculator to find its exact intrinsic value, set buy prices, and expose…
Try calculatorCalculate your true cash flow with our net operating profit after tax calculator. Strip away debt distortions from EBIT, EBITDA, or Net Income instantly.
Try calculatorAre you growing too fast? Use our sustainable growth rate calculator to find your exact revenue ceiling before a hidden cash deficit ruins your…
Try calculatorExplore Related Tools
What Your MIRR Result Means
This percentage represents the true annual return your project generates. The system compares this realistic rate directly against your WACC. A profitable project means your money grows faster than the cost to borrow it.
Understanding Your Result
Your final output acts as a corporate reality check. Standard metrics assume you reinvest cash at the project’s own high yield. MIRR strips away that dangerous optimism.
It shows exactly how your capital grows when you safely park interim profits in a standard bank account. This new metric reveals the actual wealth added to your balance sheet. Capital budgeting decisions depend entirely on this grounded number.
Is Your Result Good or Bad?
A good result easily clears your hurdle rate. Your project is highly viable if the final return sits comfortably above your finance rate. A strong margin of safety protects you against unexpected market shifts.
A bad result falls below your WACC. You must reject those projects immediately. Taking on investments that fail to cover your own borrowing costs will actively destroy company value. Break-even scenarios require careful review before moving forward.
What You Should Do Next
- Compare your final percentage against your WACC to make an instant accept or reject decision.
- Review the Net Present Value to see the exact dollar amount of wealth created by the project.
- Test different reinvestment rates to see how sensitive your project is to changing market conditions.
- Rank competing projects by their safe return instead of relying on their inflated standard yield.
A Quick Example to Test
Let us evaluate a new software upgrade project. Add these numbers into the Combination approach mode to see how the decision engine works.
Input:
- Finance Rate: 8.5%
- Reinvestment Rate: 5.0%
- Year 0 Initial Investment: -150,000
- Annual Cash Inflow: 45,000
- Project Lifespan: 5 Years
Result:
MIRR 10.62% | WACC 8.5% | Standard IRR 15.24%
Meaning:
Your project easily clears the hurdle rate. You should accept the investment because it generates positive Net Present Value and creates real wealth. The safe 10.62% return protects you from making a reckless decision based on the wildly optimistic 15.24% standard estimate.
Which Modified Internal Rate of Return Method Should You Use?
Corporate policies and finance textbooks dictate different calculation rules. While Excel uses a standard combination approach, academic exams frequently test discounting or reinvestment methods. Choose the correct logic below to ensure your final percentage matches your specific grading rubric or corporate model.
| Approach | Status | Corporate Standard | Academic Standard | How it works |
|---|---|---|---|---|
| Combination | Default | Standard for financial modeling and Excel. | Tested as the primary textbook method. | Discounts costs to Year 0, compounds returns to the end. |
| Discounting | Specialized | Rarely used in daily business operations. | Required in specific capital budgeting exams. | Discounts all negative cash flows to Year 0. |
| Reinvestment | Specialized | Used to evaluate heavy upfront capital investments. | Tested in advanced corporate finance theories. | Compounds all positive cash flows to the final year. |
Heads-up: If you remain unsure which method to select, stick with the Combination approach. It serves as the most widely accepted professional standard globally.
How to Use the Modified Internal Rate of Return Calculator
The MIRR Calculator with WACC processes your capital budgeting data instantly. It isolates your project costs from your profits to apply realistic market yields. Follow these five simple actions to evaluate your next corporate investment.
Select the Academic Approach
Choose the combination, discounting, or reinvestment method. Your textbook or corporate finance policy will usually dictate this exact choice. The standard combination setting handles most real-world business scenarios perfectly and matches Excel.
Set Your Finance and Reinvestment Rates
Enter your cost of capital to establish the baseline hurdle rate. Next, input your safe bank yield. The system uses these two distinct percentages to process your costs and profits separately.
Choose the Cash Flow Entry Mode
Pick the constant return setting if your project generates the exact same profit every year. Select the custom mode if your cash flows fluctuate annually. This feature keeps your data entry fast.
Enter Your Project Cash Flows
Input your initial startup cost as a negative number to represent outgoing cash. Then add your projected future returns. The system instantly compounds and discounts these exact numbers across the project lifespan.
Review the Final Budgeting Decision
Compare the final modified rate directly against your original finance rate. The calculator instantly highlights whether the project creates actual wealth or destroys capital. Use this clear outcome to approve project funding.
How do you calculate MIRR for a fleet expansion?
A logistics company wants to buy new delivery trucks. They evaluate the five-year return against their corporate borrowing costs.
Use these inputs in the calculator:
- Academic Approach: Combination Finance
- Rate / WACC: 8.0%
- Reinvestment Rate: 5.0%
- Year 0 Investment: -250,000
- Annual Cash Inflow: 70,000
- Project Lifespan: 5 Years
Process:
- The calculator pushes the returns to year five at the 5.0% yield.
- It keeps the initial cost at year zero.
- It then finds the exact growth rate between those two numbers.
Final Result:
- Project MIRR: 9.12%
- Net Present Value: $29,489
Meaning:
The realistic 9.12% return safely beats the 8.0% borrowing cost. The company should fund the trucks because the expansion creates nearly $30,000 in actual value.
Accuracy Behind the MIRR Capital Budgeting Engine
This tool uses standard corporate finance formulas to fix the mathematical flaws found in traditional IRR. It isolates your cash flows, applies dual-rate logic, and outputs institutional-grade metrics. Here is how the system processes your investment data.
Key Features & Benefits
- Instantly reveals if a project creates or destroys company value.
- Solves the multiple IRR math error caused by switching cash flow signs.
- Estimates Net Present Value alongside your return percentages.
- Syncs finance and reinvestment rates automatically for faster testing.
- Generates visual bar charts comparing realistic returns against optimistic ones.
Technical Process
Data Input
Captures your corporate cash flows and validates inputs before calculating any compounding or discounting metrics.
Logic Processing
Applies dual-rate adjustments to separate capital costs from realistic, market-based reinvestment yields.
Output Generation
Displays your true return percentage matched with visual charts for instant capital budgeting decisions.
Micro Insight:
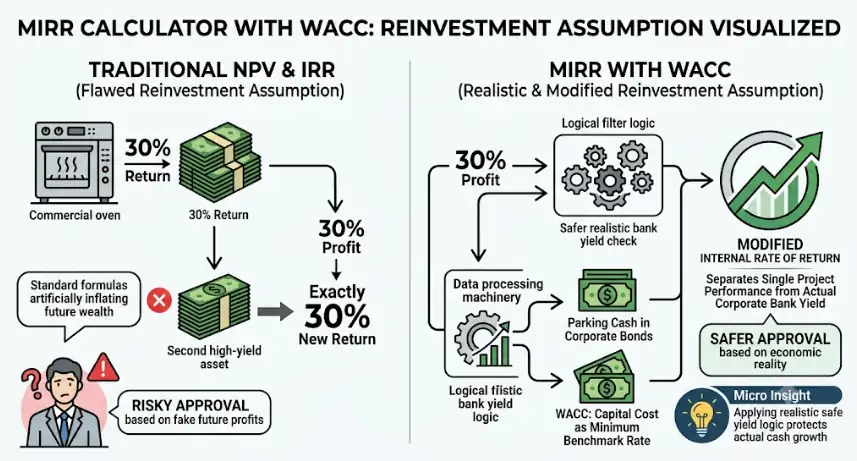
Getting this rate wrong causes executives to approve risky projects based on fake future profits. Applying a realistic safe yield protects the company from overestimating its actual cash growth.
What is the Reinvestment Assumption?
The reinvestment assumption is a financial rule defining how businesses handle extra cash. It assumes that any profit generated by a project is immediately invested into a new asset. Traditional metrics expect this new asset to earn a massive return. Modified metrics use a safer, realistic bank yield.
Imagine a business buys a commercial oven that generates a 30% return its first year. Standard formulas assume the company takes those profits and finds another investment paying exactly 30%.
Finding back-to-back high-yield investments is almost impossible in the real world. Most companies park extra cash in corporate bonds earning a much lower yield.
Ignoring this reality causes financial models to mathematically inflate expected profits. Adjusting this assumption separates a single project performance from the actual corporate bank yield.
How the Modified Internal Rate of Return (MIRR) Formula Works (Complete Breakdown)
The MIRR Calculator with WACC formula isolates your cash flows to reveal true project profitability. It calculates geometric growth by discounting investment costs and compounding future returns at safe market rates. This math fixes the dangerous optimism found in standard equations to protect your corporate budget.
What is the MIRR formula?
The formula determines your project’s realistic annual return by comparing the total future value of inflows against the present value of outflows. It divides the compounded terminal value by the discounted present cost and takes the $n$-th root to find the annual percentage.
Formula:
MIRR = ((Terminal Value of Positive Cash Flows / Present Value of Negative Cash Flows) ^ (1 / n)) - 1
Decoding Your Capital Budgeting Inputs
Each variable below matches the data you enter into the calculator. These specific numbers determine whether an investment creates wealth or drains corporate capital.
Terminal Value
This represents the total future worth of all project profits. The system compounds your periodic returns using your safe bank yield to find this final lump sum.
Present Value
This is the current financial weight of your project investment. The calculator uses your corporate hurdle rate to pull all negative cash flows back to the initial starting day.
n (Project Lifespan)
This indicates the total number of years your project operates. It dictates exactly how long your capital remains tied up before reaching the final investment horizon.
Another Example Calculation (Step-by-Step)
Let us see how the valuation model works using a fresh corporate case study. This step-by-step breakdown demonstrates how different rates directly shape your final project return percentage.
Given:
- Year 0 Initial Investment = -$200,000
- Annual Cash Inflow (Years 1 to 4) = $80,000
- Finance Rate (WACC) = 9.0%
- Reinvestment Rate = 6.0%
- Project Lifespan (n) = 4 Years
Calculation:
					Present Value of Costs = 200000
Terminal Value of Inflows = 80000*(1.06^3) + 80000*(1.06^2) + 80000*(1.06^1) + 80000 = 350141
MIRR = ((350141 / 200000) ^ (1 / 4)) - 1 = 15.02%
Result:
- Present Value of Costs: $200,000
- Terminal Value of Inflows: $350,141
- Calculated Project MIRR: 15.02%
Meaning:
Your corporate expansion project delivers a realistic return of 15.02%. This modified rate easily clears your 9.0% financing hurdle. A standard model would wrap these same cash flows into an inflated 21.86% return estimate, which dangerously overstates your actual wealth creation.
How do you calculate MIRR with WACC?
You calculate the modified internal rate of return by separating your project cash flows. Discount all negative costs to the present day using your WACC. Compound all positive returns to the final year using your safe reinvestment rate. Finally, calculate the geometric growth rate between those two totals.

How do you calculate MIRR for commercial real estate?
A property developer buys an old retail plaza, collects partial rent during renovations, and sells the upgraded asset in year three.
Use these inputs in the calculator:
- Output: -$500,000 Year 0 | $50,000 Year 1 | $50,000 Year 2 | $600,000 Year 3 Finance Rate: 7.0%
- Reinvestment Rate: 4.0%
Process:
- The system discounts the initial half-million cost at the 7.0 percent hurdle rate.
- It compounds the early rental income to the final year at a safe 4.0 percent bank yield.
- The engine then finds the exact growth gap.
Result:
- Project MIRR: 12.19%
Meaning:
This 12.19 percent realistic return easily beats the 7.0 percent borrowing cost. The developer should fund the plaza flip because it generates positive wealth.
How do you calculate MIRR for a SaaS product launch?
A software company evaluates a new platform build. This project requires heavy upfront capital but promises flat, consistent annual subscriptions.
Use these inputs in the calculator:
- Initial Investment: -$300,000
- Constant Annual Return: $90,000 Project
- Lifespan: 4 Years
- Finance Rate: 10.0%
- Reinvestment Rate: 5.0%
Process:
- The calculator pushes the flat annual returns to year four at a highly conservative 5.0 percent yield.
- It compares that terminal value directly against the initial debt obligation.
Result:
- Project MIRR: 6.63%
Meaning:
Executives must reject this launch immediately. The 6.63 percent return cannot cover the strict 10.0 percent corporate hurdle rate. Funding this software build will actively destroy company capital.
How does MIRR fix the multiple IRR problem in mining?
An energy operation requires expensive upfront equipment, generates strong middle-year profits, and demands a massive environmental cleanup fee in the final year.
Use these inputs in the calculator:
- Year 0: -$1,000,000 Year 1: $600,000 Year 2: $800,000 Year 3: -$200,000 Finance Rate: 8.0%
- Reinvestment Rate: 6.0%
Process:
- Standard formulas crash here due to alternating negative cash flows.
- This system safely discounts both negative expenses to year zero.
- It then compounds the positive middle returns to year three before calculating the final percentage.
Result:
Project MIRR: 9.52%
Meaning:
The math perfectly resolves the alternating sign error. The 9.52 percent yield safely beats the 8.0 percent WACC. This proves the mine remains profitable despite the massive backend cleanup costs.
Quick rule to remember
Never trust a standard return metric when your project involves massive future cash flows. Always set your reinvestment rate to a safe, guaranteed bank yield rather than an optimistic stock market average. Once you lock in those conservative numbers, enter your project details into the calculator to see if your next venture truly creates wealth.
MIRR Calculator with WACC Result Benchmarks Explained
Your final percentage determines whether an investment moves forward or gets scrapped. Corporate executives rely on strict benchmarks to protect company capital. Compare your calculated return against your borrowing cost below to evaluate project viability and make a clear funding decision.
| Result Range | Status | Financial Meaning | NPV Impact | Recommended Action |
|---|---|---|---|---|
| MIRR > WACC | Accepted | Returns safely exceed financing costs. | Creates positive NPV. | Approve project funding. |
| MIRR = WACC | Break-Even | Project exactly covers capital expenses. | Generates exactly zero NPV. | Review alternative options. |
| MIRR < WACC | Rejected | Borrowing costs exceed realistic returns. | Destroys company capital. | Kill the project entirely. |
Heads-up: Always use a highly conservative bank yield for your reinvestment rate to keep these benchmarks mathematically accurate.
Interpretation
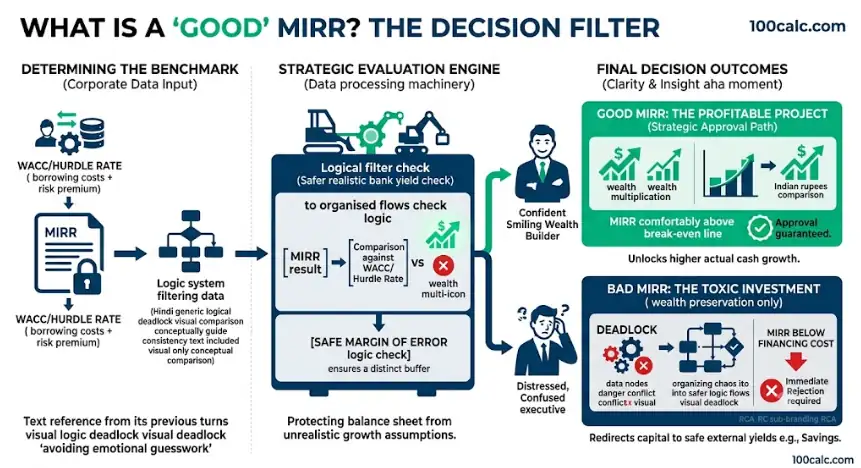
Comparing your modified return against your corporate hurdle rate gives you a definitive answer. Profitable projects sit comfortably above the break-even line. Any percentage falling below your financing cost signals a toxic investment. Strict adherence to these specific categories protects your balance sheet from unrealistic growth assumptions.
Pro Tip:
Never approve a break-even project unless it offers massive strategic value. Always prioritize investments with a wide margin of safety between your final return and your borrowing cost.
What is a Good MIRR?
Comparing your modified return against your corporate hurdle rate gives you a definitive answer. A “good” MIRR is not just one that beats your WACC; it is a return that includes a safe margin of error above your borrowing costs. Profitable projects sit comfortably above the break-even line, protecting your Capital Expenditure (CapEx) from market volatility. Any percentage falling below your financing cost signals a toxic investment. Strict adherence to these categories protects your balance sheet from unrealistic Discounted Cash Flow (DCF) growth assumptions.
What to Do After Using the MIRR Capital Budgeting Calculator
Your calculated percentage is only useful if it drives a definitive funding decision. The next step is to use your MIRR to rank competing projects, protect your capital from optimistic budgeting errors, and finalize your corporate investment strategy.

For Highly Profitable Projects
Stop comparing projects using standard IRR. Always use your new modified rate to rank mutually exclusive investments. This prevents you from approving budgets built on inflated, unrealistic mathematical assumptions.
Track your Net Present Value closely. Even if an investment shows a massive percentage return, a physically smaller project might generate fewer actual dollars. Always verify the absolute cash value before finalizing your decision.
For Break-Even Scenarios
Use a highly conservative reinvestment rate to double-check your math. Base your bank yield on safe assets like short-term Treasury bonds rather than unpredictable stock market averages. Re-run the numbers to ensure your break-even status reflects total financial reality.
Review the strategic non-financial benefits. A project that generates zero extra cash might still be worth funding. Executives often approve flat investments if they expand market share, secure patents, or block aggressive industry competitors.
For Rejected Investments
Kill the proposed project immediately. Funding an investment that fails to clear your corporate hurdle rate actively destroys company wealth. Do not attempt to lower your safety standards just to push a bad pitch through the approval process.
Shift your focus back to safe external yields. If internal company operations cannot beat your borrowing costs, you must redirect that cash. Park your excess capital in the exact high-yield savings accounts you used to run the initial calculation.
You Might Also Find These Helpful
Corporate Finance 6
No tools published here yet.
Related Tools People Use Next
Common Mistakes When Using the MIRR Calculator with WACC
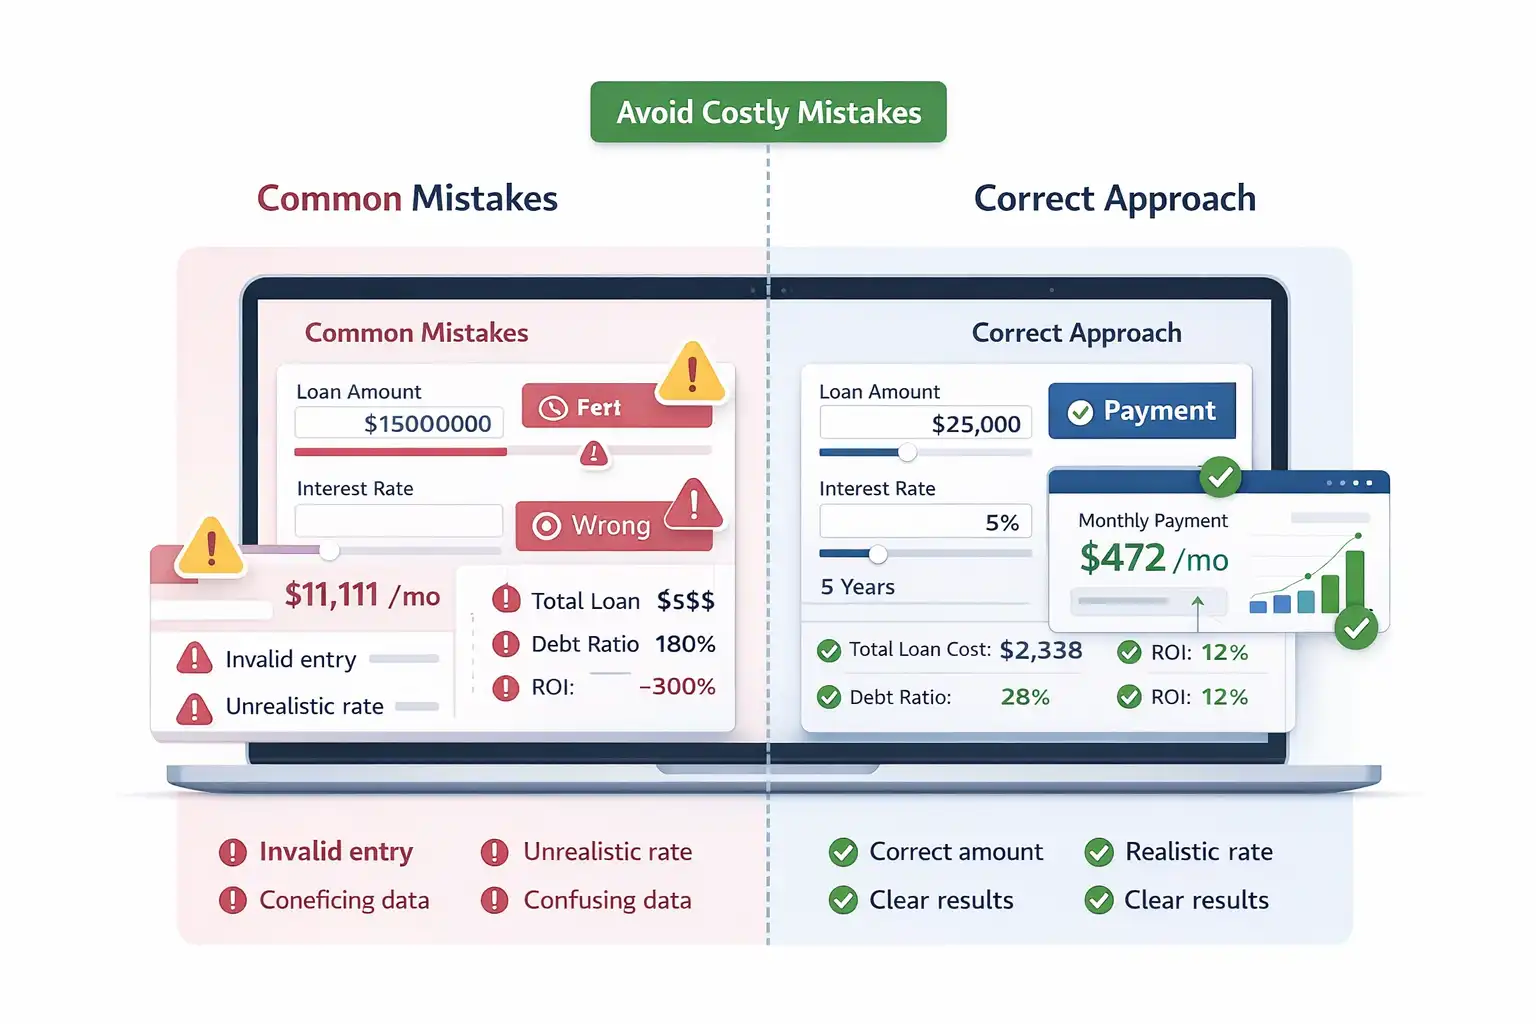
Even experienced financial analysts make basic data entry errors when modeling corporate cash flows. Small slip-ups with negative signs or interest rates can completely distort your final capital budgeting decision. Watch out for these exact issues to keep your valuation accurate.
- Forgetting to enter your initial Year 0 project investment as a negative number.
- Assuming the standard BA II Plus calculator has a built-in function instead of requiring manual math.
- Entering an overly optimistic reinvestment rate that matches the inflated standard return instead of a safe yield.
- Confusing your corporate borrowing cost with the actual interest rate you earn on deposited cash.
- Selecting the standard combination approach when your finance professor strictly requested the discounting method.
Frequently Asked Questions (FAQs)
How do I calculate MIRR on a standard BA II Plus calculator?
The standard BA II Plus lacks a dedicated MIRR button. You must manually calculate the present value of your costs and the future value of your returns. You then use the standard TVM keys to find the exact interest rate connecting them.
The Professional version of the calculator includes a built-in function that handles this math automatically.
Does MIRR fix the multiple IRR problem?
Yes, it completely resolves the multiple IRR math error. Standard formulas crash and give multiple percentage answers when cash flows switch between positive and negative across different years.
This modified approach fixes the error by grouping all costs at year zero and all profits at the final year. This guarantees one mathematically unique percentage.
How do I calculate the MIRR formula in Excel?
You compute this metric using the =MIRR(values, finance_rate, reinvest_rate) function. Highlight your entire project cash flow column to set the values. Next, type your borrowing cost and safe bank yield as decimals.
Excel defaults to the standard combination approach, which matches professional corporate budgeting models worldwide.
What is the difference between the discounting and reinvestment approaches?
The discounting approach pulls all negative future costs back to year zero while leaving positive returns in their original years. The reinvestment method pushes all positive returns to the final year while leaving costs alone.
The standard combination method performs both actions simultaneously to create the most accurate metric.
Can MIRR be higher than standard IRR?
It remains mathematically possible but occurs extremely rarely in real business scenarios. This metric only exceeds the standard rate if your safe bank yield happens to be higher than the actual project return.
Most corporate projects aim to beat bank yields, making this situation highly unusual.
What should I use for my safe reinvestment rate?
You should use a highly conservative, guaranteed yield. Most financial analysts select the current interest rate of a high-yield corporate savings account or short-term government Treasury bonds.
Avoid using optimistic stock market averages. The entire purpose of this calculation is to measure performance against a guaranteed cash baseline.
How does MIRR compare to Compound Annual Growth Rate (CAGR)?
Both metrics measure geometric growth over time. CAGR evaluates a single initial investment growing into a single final value. The modified internal rate handles complex, overlapping cash flows across multiple years.
Corporate analysts use CAGR for simple stock portfolios and switch to this modified metric for complex business projects.
Is the Modified Internal Rate of Return useful for real estate investing?
Real estate investors use this metric heavily to evaluate property flips and commercial developments. Property projects often require massive upfront capital, generate scattered rental income, and end with a large lump-sum sale.
This formula safely handles those wildly different cash events without inflating the final return estimate.
Why does increasing the finance rate sometimes increase the MIRR?
A higher finance rate heavily discounts negative cash flows that occur late in a project lifespan. Shrinking those future costs mathematically reduces your total present value obligation.
Dividing your future profits by that smaller cost base naturally pushes your final return percentage slightly higher.
How do I calculate MIRR on a standard BA II Plus calculator?
To calculate MIRR on a standard BA II Plus:
- Use the CF worksheet for cash flows.
- Calculate NPV using your finance rate.
- Calculate FV of inflows using your reinvestment rate.
- Use the TVM keys (N, PV, FV, PMT=0) to compute I/Y.
This manual process is necessary because only the Professional version includes a dedicated button.
Questions?
We had love to hear from you! Whether you are reporting an issue, suggesting a new calculator, or exploring collaboration opportunities — we are here to help. Every message helps us make 100calc smarter, faster, and more helpful for everyone.
Why People Trust 100calc
At 100calc.com, we focus on accuracy, speed, and trust. Every calculator we create is designed to give reliable, instant, and easy-to-understand results you can truly depend on.