
Sustainable Growth Rate Calculator: Expose Your True Expansion Ceiling
The sustainable growth rate is the maximum pace your company can grow revenues without issuing new equity or increasing financial leverage. It multiplies your return on equity by your retention ratio to reveal your exact expansion ceiling. Growing faster than this rate creates a cash deficit that forces you to seek external funding.
Most business owners celebrate rapid sales spikes. They rarely realize that scaling too fast secretly destroys cash reserves until it is too late. You might be targeting a revenue goal your balance sheet simply cannot afford.
This sustainable growth rate calculator processes your financial data to expose your true operational limits. You will discover precisely how much you can expand using current profits. It also computes your internal growth rate to show what happens if you refuse to take on new debt.
Quick Facts
- Calculates your maximum sustainable revenue ceiling instantly.
- Exposes critical cash deficits when targets exceed capacity.
- Generates your internal growth rate for zero-debt scenarios.
- Supports raw accounting data and the advanced DuPont method.
Corporate Finance & Forecasting
Sustainable Growth Rate Calculator
Determine the maximum growth rate your company can sustain without increasing financial leverage or issuing new equity. Choose your starting data type below.
The fastest method. Enter your Return on Equity (ROE) and adjust the payout slider.
The "Golden Rule" of SGR
The Sustainable Growth Rate assumes your business will maintain its current target capital structure (debt-to-equity ratio) and will not issue any new shares of equity to fund operations.
Sustainable Growth Rate (SGR)
%
Earnings Allocation Model
How do I calculate the sustainable growth rate?
How is sustainable growth calculated?
How much will $1000 grow in 20 years?
How to calculate CAGR from 2026 to 2030?
Explore More Calculators
Use this After-Tax Cost of Debt Calculator to find your true effective rate. Factor in corporate tax shields, estimate Bond YTM, and uncover exact…
Try calculatorAre adjusters using flawed reports to lowball your claim? Calculate your true Actual Cash Value (ACV) to expose hidden depreciation and maximize payouts.
Try calculatorStop guessing your hurdle rates. Use this Cost of Equity Calculator to run CAPM or DGM models. Expose hidden market risks and find your…
Try calculatorIs that high-yield dividend stock a trap? Use our Gordon Growth Model calculator to find its exact intrinsic value, set buy prices, and expose…
Try calculatorStandard IRR inflates your profits. Use our MIRR Calculator with WACC to calculate true project returns, safely reinvest cash, and find exact NPV instantly.
Try calculatorCalculate your true cash flow with our net operating profit after tax calculator. Strip away debt distortions from EBIT, EBITDA, or Net Income instantly.
Try calculatorExplore Related Tools
What Your Sustainable Growth Rate Means
Your calculated percentage represents your exact expansion ceiling under your current financial policies. Hitting this exact number means your business funds its growth entirely through retained earnings and proportional debt.
Understanding Your Result
This percentage reveals how fast your sales can increase before you run out of cash. Expanding faster than this rate forces you to seek outside funding. You will need to borrow more money from banks or sell equity to new investors.
Staying within this calculated limit keeps your current ownership structure intact. It proves your internal profit engine generates enough fuel to cover your daily operating costs as you scale.
Is Your Result Good or Bad?
A good result aligns closely with your actual sales targets. If your sustainable growth rate sits above your target, your business generates surplus cash. You are in a highly secure financial position.
A bad result falls significantly below your target growth. This creates a dangerous cash deficit that will quickly drain your bank accounts. A negative percentage is a severe warning that your operations are actively destroying capital.
What You Should Do Next
- Compare your calculated ceiling directly against your upcoming revenue goals. If your goals are higher than your sustainable rate, you must adjust your financial strategy immediately.
- Cut your dividend payouts first if you face a growth deficit. Keeping more cash in the business is the fastest way to raise your ceiling.
- Review your profit margins to see if slight price increases can boost your return on equity. Prepare to negotiate bank loans or pitch investors if you absolutely must pursue an aggressive expansion target.

A Quick Example to Test
Let us test a manufacturing company planning an aggressive national rollout using the raw data method.
Input:
- Method: From Raw Data
- Net Income: $400,000
- Dividends Paid: $100,000
- Total Equity: $2,000,000
- Target Sales Growth: 22%
Process:
The system determines the return on equity is 20 percent. It calculates a retention ratio of 75 percent based on the dividend payout. Multiplying these figures reveals the maximum sustainable growth limit.
Result:
- Sustainable Growth Rate (SGR): 15%
- Growth Deficit: 7%
Meaning:
The manufacturer can only support a 15 percent growth rate organically. Hitting their 22 percent target leaves them with a severe 7 percent funding gap. They must secure outside capital or reduce dividend payments to survive this expansion.
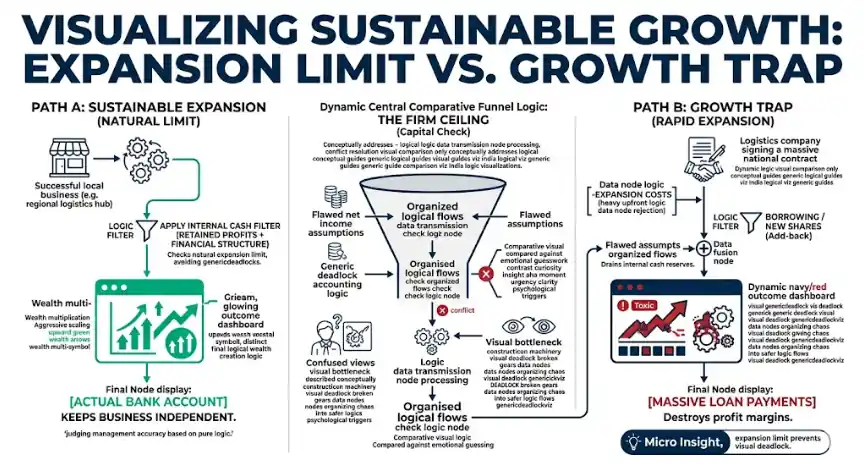
What exactly is sustainable growth?
Sustainable growth is the maximum speed a business can expand its sales without borrowing more money from a bank or selling new shares to investors. It represents your natural expansion limit. Your retained profits and current financial structure create this firm ceiling.
Every business needs capital to fund new operations. Increasing your sales always increases your daily operating costs. Growing faster than your internal cash allows will rapidly drain your reserves.
Think of a regional logistics company that signs a massive national contract. Management must buy a new fleet of trucks to fulfill these unexpected orders. Current retained profits cannot cover the purchase.
The company must take out heavy bank loans to survive. This rapid expansion looks successful at first glance. Soon, massive monthly loan payments completely destroy their profit margins.
Knowing your expansion limit prevents this hidden growth trap. It ensures your ambition never outpaces your actual bank account. This strict financial discipline keeps your business profitable and completely independent.
Which Starting Method Should You Use?
You must choose the right calculation method based on the financial data you have available. Selecting the correct approach ensures your projection aligns with standard corporate finance practices. Review the options below to find the best fit for your specific accounting model.
| Starting Method | Method Type | How It Works | Data Required | Best Application |
|---|---|---|---|---|
| From Ratios | Fast Estimation | Multiplies ROE by your plowback ratio via slider. | Return on Equity and Payout Percentage. | Quick top-down planning and academic scenarios. |
| From Raw Data | Balance Sheet | Derives strict percentages from raw monetary inputs. | Exact Net Income, Dividends, and Total Equity. | Private businesses running full financial reviews. |
| DuPont Method | Advanced CFA | Breaks ROE into distinct operational drivers. | Margin, Asset Turnover, and Equity Multiplier. | Analysts identifying the exact cause of slow growth. |
Heads-up: If you want to isolate your daily operational efficiency from your financial leverage, select the DuPont Method.
How to Use the SGR Calculator
This calculator strips away financial noise to reveal your exact revenue expansion ceiling. It processes your input through standard corporate finance equations to determine how fast you can grow organically. Follow these steps to find your sustainable limit instantly.
Select your starting financial method
Choose the data path that matches your available accounting numbers. You can start with basic Return on Equity ratios. You can also use raw balance sheet data or run an advanced DuPont analysis.
Enter your core profitability numbers
Input the exact financial figures required for your selected method. The system needs your net income and total equity for raw data calculations. It requires your net profit margin and asset turnover if you choose the DuPont approach.
Adjust your retention ratio
Use the slider to set your dividend payout percentage. The calculator automatically adjusts your retention ratio to match. This slider shows exactly how paying dividends reduces the cash available to fund your business expansion.
Input your target sales growth
Enter the annual revenue growth rate you want to achieve. This optional step allows the system to compare your ambition against your financial reality. It will expose any cash deficits your target creates.
Review your sustainable growth ceiling
The system instantly displays your maximum sustainable growth rate. It also reveals your internal growth rate and calculates your exact growth deficit. Use this data to adjust your financial strategy or prepare for external funding.
Let us run a standard test using the basic ratio method for a software company that reinvests most of its profits.
Use these inputs in the calculator:
- Method: From Ratios
- Return on Equity: 18%
- Payout Slider: 30%
- Target Sales Growth: 20%
Process:
The system subtracts the 30 percent dividend payout to find a 70 percent retention ratio. It multiplies this retention ratio by the 18 percent return on equity. Finally, it compares the resulting sustainable growth rate against the 20 percent target.
Final Result:
- Sustainable Growth Rate: 12.60%
- Growth Deficit: 7.40%
Meaning:
The software company can only sustain a 12.60 percent expansion organically. Hitting their aggressive 20 percent target will cause a severe cash shortage. They must lower their dividend payout or secure outside funding.
Accuracy and Method Behind the Sustainable Growth Rate Calculator
This valuation engine uses strict corporate finance formulas to project growth limits. It separates internal cash generation from external funding needs. This backend system prevents aggressive sales targets from hiding severe cash flow shortfalls. You can trust the results for advanced corporate planning and investment analysis.
Key Features & Benefits
- Instantly flags dangerous hyper-growth deficits to protect business cash reserves.
- Converts complex DuPont inputs into clean return on equity metrics automatically.
- Compares sustainable growth against internal growth rates to evaluate leverage needs.
- Processes interactive dividend payout scenarios in real-time via slider adjustments.
- Aligns directly with standard investment banking and institutional evaluation models.
Technical Process
Data Input
The system captures your financial figures and runs error checks to validate inputs.
Logic Processing
The algorithm applies selected top-down or bottom-up parameters to execute your calculation.
Output Generation
The dashboard displays your growth ceiling alongside matching performance state badges instantly.
How the Sustainable Growth Rate Formula Works (Complete Breakdown)
This calculator uses core financial ratios to reveal your company’s maximum organic expansion speed. It multiplies your return on equity by your retention ratio to determine your precise growth ceiling. The system bypasses external funding factors to deliver a clear snapshot of your internal capital generation.
The Sustainable Growth Formulas
					Sustainable Growth Rate (SGR) = Return on Equity (ROE) × Retention Ratio

Internal Growth Rate (IGR) = Return on Assets (ROA) × Retention Ratio

Retention Ratio = 1 - Dividend Payout Ratio
What Each Variable Means
Each financial input below alters your final growth output. Understanding these metrics helps you determine where your business model leaks potential expansion capital.
The PRAT Model Breakdown
Financial analysts often expand the standard formula into the PRAT model to isolate specific operational drivers. This framework breaks your growth ceiling into four distinct metrics.
- P (Profit Margin): How efficiently you convert sales into net income.
- R (Retention Rate): The percentage of earnings you keep instead of paying out as dividends.
- A (Asset Turnover): How well you use your equipment and inventory to generate revenue.
- T (Total Financial Leverage): Your reliance on debt to multiply your equity base.
Return on Equity (ROE)
Your net income divided by total shareholder equity. It measures how effectively your management team turns investor funds into pure profit. A higher return directly increases your sustainable expansion ceiling without requiring new bank loans.
Retention Ratio
Financial analysts frequently call this the plowback ratio. It represents the exact percentage of net income kept inside the business after paying investor dividends. Retaining more earnings provides the necessary cash fuel to fund aggressive revenue targets.
Internal Growth Rate (IGR)
The maximum revenue growth achievable using strictly retained earnings and zero new external debt. Finance students often debate this formula on forums because some textbooks divide the result by (1 – (ROA × Retention)). Our calculator utilizes the direct multiplication method favored in standard top-down financial modeling.
Return on Assets (ROA)
Your net income divided by your total corporate assets. This metric is utilized exclusively for the internal baseline calculation. It measures your overall asset efficiency rather than focusing solely on shareholder equity.
Another Example Calculation (Step-by-Step)
Let us see how the valuation engine processes raw financial data to find your organic ceiling. This follows the exact logic used in real-world corporate planning to avoid dangerous cash deficits.
Given:
- Return on Equity = 15%
- Net Income = $200,000
- Dividends Paid = $80,000
Calculation:
					Retention Ratio = 1 - ($80,000 ÷ $200,000)
Retention Ratio = 1 - 0.40 = 0.60 (60%)

SGR = 15% × 60% = 9%
Result:
- Current Retention Ratio: 60%
- Sustainable Growth Rate: 9%
Meaning:
The business pays out 40 percent of its earnings to shareholders and keeps 60 percent. By reinvesting that retained cash at a 15 percent return on equity, the company can comfortably grow its sales by 9 percent annually without altering its financial structure.
How do you calculate sustainable growth rate?
Calculate your sustainable growth rate by multiplying your return on equity by your retention ratio. First, find your return on equity by dividing net income by total shareholder equity. Next, determine the percentage of earnings you retain after paying dividends. Finally, multiply those two figures to find your exact growth ceiling.
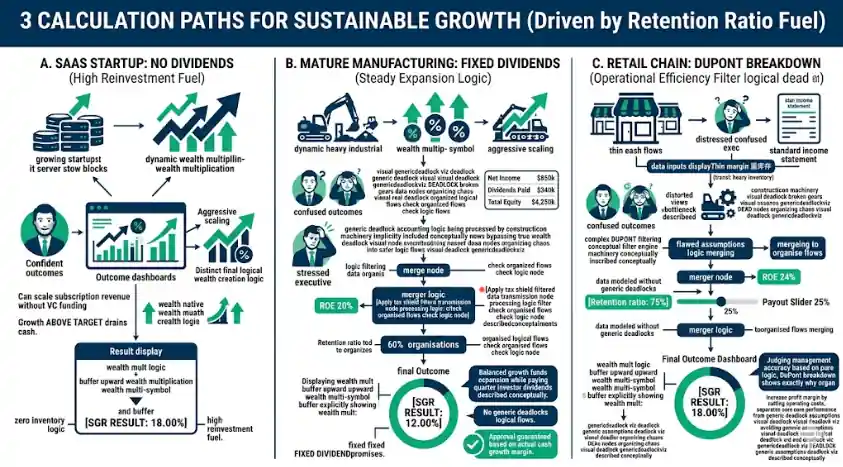
How do you calculate the sustainable growth rate for a SaaS startup?
A growing tech company needs to know how fast its subscription revenue can scale without requiring a new round of venture capital funding.
Use these inputs in the calculator:
- Method: From Ratios
- Return on Equity: 18%
- Payout Slider: 0%
Process:
Because the startup reinvests all profits back into customer acquisition, the retention ratio is 100 percent. The system multiplies the 18 percent ROE by 1.0.
Result:
- Sustainable Growth Rate (SGR): 18.00%
- Retention Ratio: 100.00%
Meaning:
The startup can safely grow its sales by 18 percent annually. Any growth above that 18 percent target will drain their current cash reserves, forcing them to raise new equity.
What is the sustainable growth rate for a mature manufacturing firm?
An established factory wants to forecast its production expansion limits while continuing to pay its regular quarterly investor dividends.
Use these inputs in the calculator:
- Method: From Raw Data
- Net Income: $850,000
- Dividends Paid: $340,000
- Total Equity: $4,250,000
Process:
The system determines the ROE is 20 percent. It calculates the dividend payout ratio is 40 percent, leaving a retention ratio of 60 percent. It then multiplies the 20 percent ROE by the 60 percent retention.
Result:
- Sustainable Growth Rate (SGR): 12.00%
- Retention Ratio: 60.00%
Meaning:
The manufacturer can grow its operations by 12 percent each year. This steady pace allows them to fund expansion internally while still keeping their current dividend promises to shareholders.
How do you find the sustainable growth rate using the DuPont method?
A corporate finance analyst wants to break down exactly why a retail chain is struggling to fund its new store locations organically.
Use these inputs in the calculator:
- Method: DuPont Method
- Net Profit Margin: 8%
- Asset Turnover: 1.5x
- Equity Multiplier: 2.0x
- Payout Slider: 25%
Process:
The system multiplies the margin, turnover, and leverage multiplier to find a 24 percent ROE. It then applies the 75 percent retention ratio (based on the 25 percent payout).
Result:
- Return on Equity (ROE): 24.00%
- Sustainable Growth Rate (SGR): 18.00%
Meaning:
The retail chain has an 18 percent organic growth ceiling. If they want to expand faster, the DuPont breakdown shows they could increase their 8 percent net profit margin by cutting operating costs.
Quick rule to remember
Focus strictly on your retention ratio. High profits mean nothing if you pay everything out as dividends. Retained earnings act as the primary fuel for sustainable expansion. Enter your own financial numbers above to see exactly how fast your business can safely scale.
How Sustainable Growth Varies by Industry
A healthy growth ceiling depends entirely on your specific sector and capital requirements. You must compare your result against industry norms to gauge your true performance.
- SaaS and Tech (15% to 25%): Software companies often carry zero inventory and boast high profit margins. They can sustain much higher organic growth rates.
- Manufacturing (8% to 12%): Heavy industries require massive equipment purchases to scale. Their sustainable ceilings are naturally lower due to high asset costs.
- Retail (5% to 10%): Traditional retail relies on thin profit margins and heavy inventory. A 10 percent sustainable growth rate is often considered exceptional in this space.
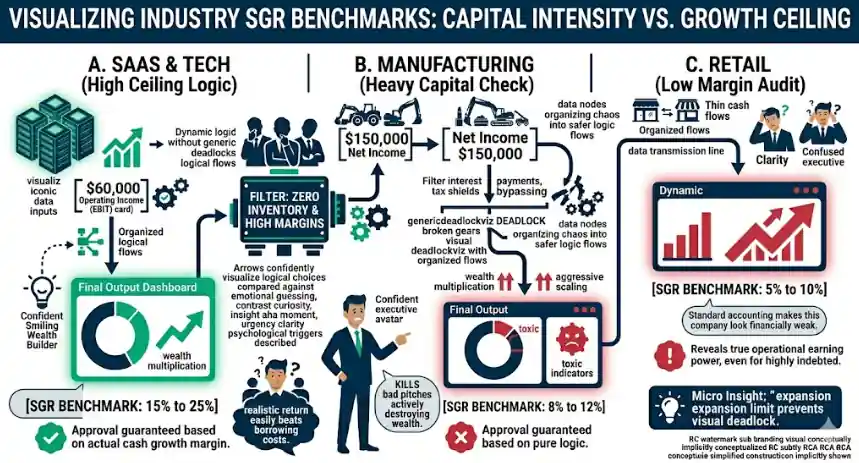
Sustainable Growth Rate Result Benchmarks Explained
Your calculated percentage is a strict financial boundary, not a suggestion. It defines exactly how fast your sales can increase before your operations run out of internal cash. Use these corporate benchmarks to evaluate your current growth limits and adjust your expansion plans accordingly.
| Output State | Category | Financial Meaning | Corporate Impact | Recommended Action |
|---|---|---|---|---|
| SGR > Target Growth | Steady & Sustainable | Internal cash easily funds current expansion goals. | Generates surplus cash for reserves or dividends. | Maintain current leverage and dividend policies. |
| Target > SGR | Hyper-Growth Risk | Expansion outpaces internal cash generation. | Creates an immediate funding deficit. | Cut dividends, raise equity, or secure new loans. |
| SGR > 20% | Aggressive High Growth | Exceptional internal profitability and efficiency. | Rapidly scales operations without outside help. | Watch closely for operational burnout or market saturation. |
| SGR < 0% | Capital Depletion | The business is actively losing money. | Operations drain the existing capital base. | Halt expansion immediately and restructure costs. |
Heads-up: Highly leveraged companies may show a high SGR. Always check your Internal Growth Rate (IGR) to see your true capacity without debt.
Interpretation
Hitting the steady zone means your profit engine perfectly supports your ambition. Your business can safely scale operations without visiting a bank or selling shares. Falling into the hyper-growth risk category is a massive warning sign. It proves your sales goals will bankrupt your daily operations unless you secure external funding immediately.
Pro Tip:
If you face a growth deficit, lower your dividend payouts before seeking bank loans. Retaining more internal earnings is the fastest and cheapest way to raise your sustainable ceiling.
What to Do After Using the Sustainable Growth Rate Calculator
Your calculated percentage is only valuable if it guides your corporate strategy. The next step involves using your sustainable growth rate to adjust your dividend policy, secure outside funding, or improve operational efficiency. Focus on aligning your financial structure with your actual revenue goals.
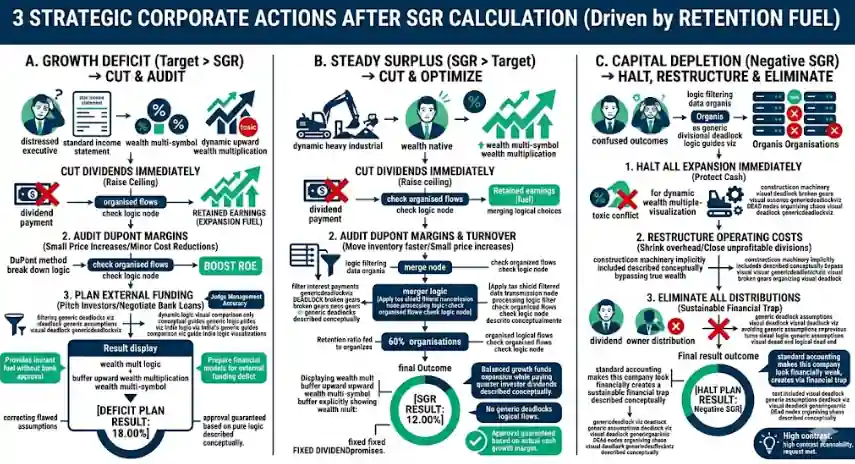
For a Growth Deficit (Target > SGR)
Cut your dividend payments immediately. Retaining more cash inside your business is the fastest way to raise your organic growth ceiling. Eliminating distributions provides instant fuel for your expansion plans without requiring bank approval.
Audit your net profit margins using the DuPont method. Small price increases or minor cost reductions boost your return on equity directly. This increased efficiency allows you to fund more aggressive sales targets internally.
Plan for external funding before your cash reserves run dry. If you refuse to lower dividends or cannot increase margins, you must secure outside capital. Prepare your financial models to pitch new investors or negotiate commercial bank loans.
For a Steady Surplus (SGR > Target)
Cut your dividend payments immediately. Retaining more cash inside your business is the fastest way to raise your organic growth ceiling. Eliminating distributions provides instant fuel for your expansion plans without requiring bank approval.
Audit your net profit margins and asset turnover using the DuPont method. Small price increases or moving inventory faster will boost your return on equity directly. This increased operational efficiency allows you to fund more aggressive sales targets internally.
Plan for external funding before your cash reserves run dry. If you refuse to lower dividends or cannot optimize your asset turnover, you must alter your financial leverage. Prepare your financial models to pitch new investors or negotiate commercial bank loans to cover the deficit.
For Capital Depletion (Negative SGR)
Halt all expansion plans immediately to protect your remaining cash. A negative growth rate means your core operations are actively destroying shareholder wealth. Trying to scale a losing business model will only accelerate your path toward bankruptcy.
Restructure your operating costs to return to profitability. Focus entirely on shrinking your overhead expenses and closing unprofitable divisions. You cannot focus on revenue growth until your bottom-line net income turns positive again.
Eliminate all owner distributions and investor dividends. Paying out cash while the business bleeds capital creates an unsustainable financial trap. Keep every single dollar inside the company until you fix your core profitability issues.
You Might Also Find These Helpful
Corporate Finance 6
No tools published here yet.
Related Tools People Use Next
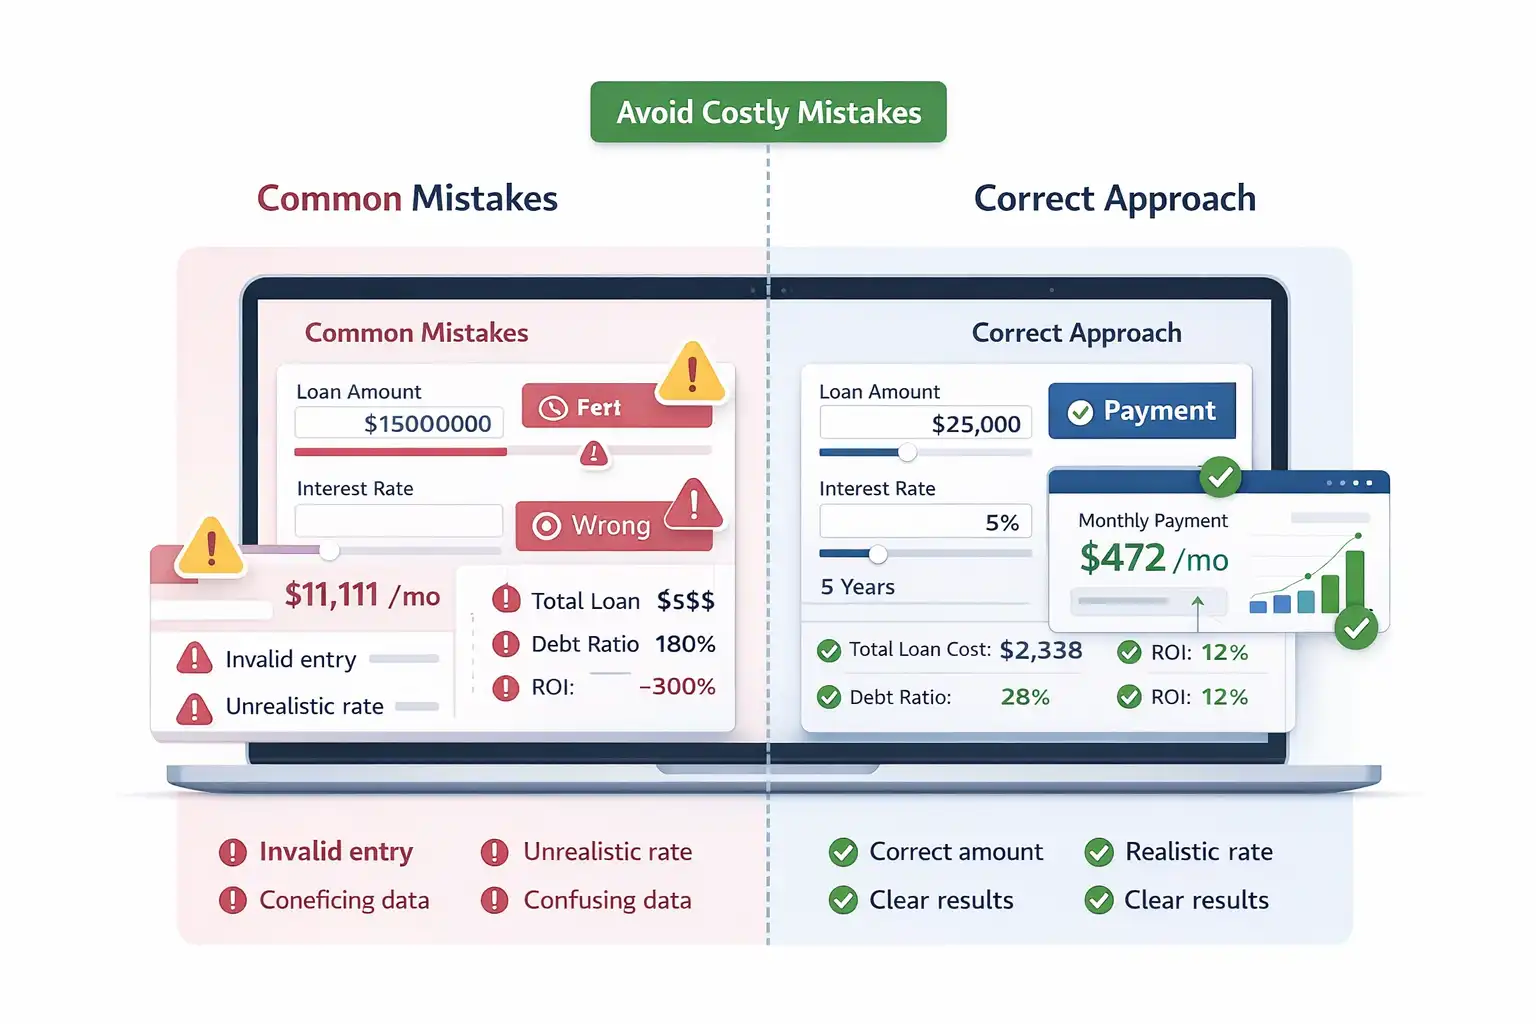
Common Mistakes When Using the Sustainable Growth Rate Calculator
Small input errors quickly distort your corporate financial forecasting. Many business owners misinterpret their expansion limits by entering the wrong accounting metrics or misunderstanding the underlying capital structure rules. Review these frequent modeling errors to ensure your final percentage reflects true operational reality.
- Confusing the sustainable growth rate limit with your zero-debt internal growth rate ceiling.
- Forgetting that this financial model assumes you will actively maintain your current debt-to-equity leverage ratio.
- Entering raw gross profit figures instead of using your final bottom-line net income.
- Setting aggressive target sales goals without reviewing the resulting cash funding deficit.
- Ignoring the asset turnover metric when using the DuPont method to diagnose stalled corporate expansion.
Frequently Asked Questions (FAQs)
What is the difference between sustainable growth rate and internal growth rate?
Sustainable growth rate assumes you will take on new debt to maintain your current leverage ratio as your equity grows. Internal growth rate assumes you will use absolutely zero new debt, relying purely on retained earnings to fund operations.
This distinction helps management decide if they want to remain completely debt-free while scaling.
What happens if my target growth exceeds my sustainable growth rate?
You will immediately hit a cash deficit. To fund this shortfall, you must issue new shares of stock, increase your debt borrowing beyond your normal ratio, improve your profit margins, or lower your dividend payouts.
Aggressive expansion without securing this external funding will rapidly drain your cash reserves.
Can the sustainable growth rate be negative?
Yes. A negative percentage occurs when a company reports a net loss, resulting in a negative return on equity. This means the business is actively shrinking its capital base.
You cannot fund any growth organically until you fix your core profitability issues and return to positive earnings.
Why is the DuPont formula useful for finding your growth ceiling?
The DuPont method breaks return on equity into three specific parts: net profit margin, asset turnover, and financial leverage. This shows executives exactly which operational lever they need to pull to improve their sustainable growth limit.
It completely isolates operational efficiency problems from simple debt structure issues.
What is considered a good sustainable growth rate?
A good sustainable growth rate typically aligns with or slightly exceeds your company’s long-term sales targets. It proves you can fund your expansion goals internally without risking dangerous levels of new bank debt.
Rates above 20 percent usually indicate exceptional efficiency but require careful market monitoring to avoid burnout.
How does the dividend payout ratio affect sustainable growth?
Paying higher dividends leaves less cash inside your corporate accounts, directly lowering your retention ratio. This starves your organic expansion engine.
To maximize your sustainable growth capacity, you must retain your earnings rather than distributing them to your shareholders as payouts.
What is the PRAT model in corporate finance?
The PRAT model calculates your growth ceiling using four distinct drivers: Profit margin, Retention rate, Asset turnover, and Total financial leverage. It expands the standard formula for deeper financial analysis.
Investment analysts use PRAT to identify exactly where a company generates or loses its growth capacity over time.
Can a company's sustainable growth rate exceed its return on equity?
No. Your sustainable growth rate cannot surpass your return on equity under normal conditions. Because you cannot retain more than 100 percent of your earnings, your growth ceiling will only equal your return on equity if you pay zero dividends.
How does inflation impact a company's sustainable growth rate?
Rising inflation increases inventory and daily operational costs. This often compresses net profit margins if you cannot raise product prices fast enough to cover the difference.
Can a company's sustainable growth rate exceed its return on equity?
Your sustainable growth rate cannot surpass your return on equity under normal conditions. This limit exists because you cannot retain more than 100 percent of your earnings. Your expansion ceiling will perfectly match your return on equity only if you pay zero dividends to shareholders.
Why does a higher dividend payout ratio lower your corporate growth capacity?
Paying higher dividends leaves less cash inside your corporate bank accounts. This reduces the internal funding available to purchase inventory or expand facilities. Shifting your capital toward investors directly starves your organic expansion engine. Retaining those earnings is required to fund aggressive long-term revenue targets.
How can a business increase its organic growth ceiling without taking on new loans?
You can lift your organic expansion capacity by boosting your core operational efficiency. Focus on raising your net profit margins through cost reductions. Alternatively, speed up your asset turnover to generate more revenue from your current equipment without altering your financial leverage.
Is an extremely high sustainable growth rate always a good sign for investors?
A massive growth ceiling is not always safe. It often points to a highly leveraged capital structure rather than excellent operational efficiency. Investors must check whether high debt levels or genuine net profit margins drive the calculation before buying new shares.
How do you build a sustainable growth rate model in Excel?
Place your return on equity in one cell and your dividend payout in another. Calculate your retention ratio by subtracting the payout percentage from 100 percent. Multiply your return on equity cell by your retention cell to find the growth ceiling.
Questions?
We had love to hear from you! Whether you are reporting an issue, suggesting a new calculator, or exploring collaboration opportunities — we are here to help. Every message helps us make 100calc smarter, faster, and more helpful for everyone.
Why People Trust 100calc
At 100calc.com, we focus on accuracy, speed, and trust. Every calculator we create is designed to give reliable, instant, and easy-to-understand results you can truly depend on.