
Gordon Growth Model Calculator: Find Your Intrinsic Stock Value
The Gordon Growth Model (DDM) calculator determines the exact mathematical value of a dividend-paying stock. It discounts an infinite series of expected future dividends back to their present value. This valuation engine reveals a stock’s true intrinsic worth. The tool also models two-stage high-growth phases and reverse-engineers current market prices to extract hidden growth expectations.
Most investors buy dividend stocks based purely on emotion or high yields. They rarely check if the math actually supports the current share price. You might be paying a massive premium for a stock. That investment could mathematically underperform your required return.
This calculator strips away market hype. Enter your expected dividend, cost of equity, and long-term growth rate. Our system instantly reveals your maximum safe buy price. It exposes overpriced dividend traps before you risk your capital.
Quick Facts
- Calculates exact intrinsic value using future cash flows.
- Exposes overvalued dividend traps instantly.
- Extracts implied market expectations from current share prices.
- Applies a strict margin of safety for risk management.
- Updated Jun 17, 2026
- Reviewed by 100Calc Research Team
Stock Valuation & Equity Research
Gordon Growth Model Calculator
Calculate the intrinsic value of a stock, analyze two-stage dividend growth, or reverse-engineer the market's implied growth rate based on current prices.
Classic Gordon Growth Model assuming a constant perpetual growth rate.
Intrinsic Value Per Share
Total Return Breakdown
People Also Ask
How to calculate growth rate in Gordon model?
How much will $1000 grow in 20 years?
How much will $50,000 be worth in 20 years?
What is the Gordon Growth Model in simple terms?
Explore More Calculators
Use this After-Tax Cost of Debt Calculator to find your true effective rate. Factor in corporate tax shields, estimate Bond YTM, and uncover exact…
Try calculatorAre adjusters using flawed reports to lowball your claim? Calculate your true Actual Cash Value (ACV) to expose hidden depreciation and maximize payouts.
Try calculatorStop guessing your hurdle rates. Use this Cost of Equity Calculator to run CAPM or DGM models. Expose hidden market risks and find your…
Try calculatorStandard IRR inflates your profits. Use our MIRR Calculator with WACC to calculate true project returns, safely reinvest cash, and find exact NPV instantly.
Try calculatorCalculate your true cash flow with our net operating profit after tax calculator. Strip away debt distortions from EBIT, EBITDA, or Net Income instantly.
Try calculatorAre you growing too fast? Use our sustainable growth rate calculator to find your exact revenue ceiling before a hidden cash deficit ruins your…
Try calculatorExplore Related Tools
What Your Intrinsic Value Means
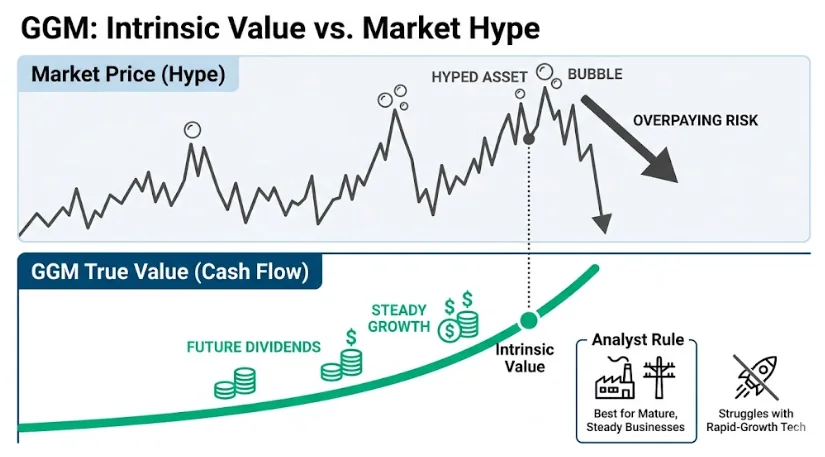
Your calculated intrinsic value represents the exact mathematical price a stock is worth today based purely on its future cash generation. It strips away temporary market hype and emotional trading to reveal a solid fundamental baseline. Comparing this core valuation against the current stock price tells you immediately whether an asset is cheap or expensive.
Understanding Your Result
This number serves as your strict financial anchor. It reveals the maximum price you can pay for a share to achieve your required rate of return. Value investors rely on this specific figure to avoid buying into dangerous market bubbles. It proves whether a company generates enough cash to actually justify its current market capitalization.
Is Your Result Good or Bad?
A good result means the stock’s intrinsic value sits significantly higher than its current market price. This spread creates an undervalued buying opportunity. A bad result occurs when the current market price far exceeds your calculated intrinsic value. This indicates the stock is severely overvalued, signaling you should avoid buying or consider selling your position.
What You Should Do Next
- Compare your calculated intrinsic value directly against the current market price before executing any trades.
- If the stock is cheap, verify that your growth rate assumptions are realistic before buying.
- If the stock is expensive, hold your cash and wait for a market correction to lower the price.
- Run the calculator backward using the reverse-engineering mode on highly priced stocks to see what absurd growth rates the market expects.

A Quick Example to Test
Let us test a mature consumer goods company to see if it is currently overpriced.
Input:
- Model: Constant Growth
- Dividend Type: Just Paid (D0)
- Dividend: $4.00
- Cost of Equity: 9%
- Growth Rate: 4%
- Market Price: $95.00
- Margin of Safety: 10%
Process:
The system calculates the expected dividend ($D1) as $4.16 by multiplying $4.00 by 1.04. It divides $4.16 by the 5 percent spread (9% minus 4%) to find the mathematical value. Finally, it applies the 10 percent safety discount.
Result:
- Intrinsic Value: $83.20
- Max Buy Price: $74.88
- State: Overvalued (Sell)
Meaning:
The stock is mathematically worth $83.20. The current market price of $95.00 makes it far too expensive. You must wait for the price to drop below your strict $74.88 buy target before investing safely.
Why This Matters for Investors
This concept forces you to think like a business owner rather than a stock trader. Focusing strictly on cash flow generation prevents you from overpaying for hyped assets during a dangerous market bubble.
What is the Gordon Growth Model (GGM)?
The Gordon Growth Model (GGM) is a fundamental financial formula used to determine the true value of a stock. It assumes a company will continue to pay out dividends that grow at a steady rate forever. This approach ignores daily market price fluctuations and focuses entirely on future cash flows.
Understanding the Cash Flow Concept
Investors use this method to separate a company’s mathematical worth from stock market hype. Buying shares means you are purchasing the right to receive future profits. Valuing a business becomes straightforward if you know exactly how much cash it will return to you over time.
Imagine buying a rental property that guarantees rent increases every year. The price you pay today depends heavily on how much that rent will grow and what minimum return you demand. This exact same logic applies to corporate dividend payouts.
Financial analysts rely on this framework primarily for mature businesses with long histories of steady distributions. It struggles to evaluate rapid-growth technology companies that reinvest all their profits instead of paying shareholders directly.
Which Valuation Method Fits Your Investment Strategy?
You must select the correct mathematical approach based on the company’s growth stage and your specific analytical goals. Use the table below to match the right Gordon Growth Model variation to your target stock profile before entering data.
| Valuation Model | Target Profile | US Market Norms | Global Market Norms | Core Constraint |
|---|---|---|---|---|
| Constant Growth | Stable Income | Standard for mature utility and energy conglomerates. | Widely applied to steady banking blue-chips. | Perpetual growth must be less than cost of equity. |
| Two-Stage Growth | Transitioning | Used for tech firms establishing steady dividends. | Fits manufacturing firms expanding into new regions. | Requires an accurate duration estimate for phase one. |
| Reverse Engineer | Expectation Check | Exposes overhyped growth stocks on major indexes. | Verifies if cross-border pricing is highly realistic. | Requires an accurate current market share price. |
Heads-up: The constant growth model breaks completely if your growth rate equals or exceeds your cost of equity. Always keep your perpetual estimates conservative.
How to Use the Gordon Growth Model Calculator
This tool processes future cash flows to find the mathematical value of a dividend stock. It handles complex discounting automatically. You just provide basic growth estimates and market prices to see the result.
Select your valuation mode
Choose between constant growth, two-stage modeling, or reverse engineering. The constant option values mature companies perfectly. Two-stage modeling fits businesses transitioning from rapid expansion. Reverse engineering extracts market expectations directly from current share prices.
Define your dividend
Enter the most recent annual payout or the projected distribution for next year. The system automatically converts past dividends into expected future cash flows. This ensures the math aligns with standard equity research practices.
Set your required return
Input your cost of equity to establish a minimum acceptable profit margin. This percentage reflects the baseline return you demand for taking on market risk. It acts as the primary discount rate for future cash.
Estimate perpetual growth
Enter the constant percentage you expect the dividend to increase every year. This rate must remain strictly lower than your cost of equity. Overestimating this specific figure will break the valuation model entirely.
Set your safety margin
Adjust the slider to apply a strict discount to the final calculation. This buffer protects your capital against incorrect growth assumptions or sudden market downturns. It generates your absolute maximum safe buy price instantly.
How do you evaluate a stock experiencing temporary high growth? Let us test a hardware company using the two-stage model.
Use these inputs in the calculator:
- Valuation Model: Two-Stage Growth
- Dividend Type: Just Paid (D0)
- Dividend: $1.50
- Cost of Equity: 11%
- High Growth Phase: 15%
- Duration: 3 Years
- Terminal Growth Rate: 4%
- Market Price: $25.00
- Margin of Safety: 20%
Process:
The calculator projects the $1.50 dividend forward at 15 percent for three years. It discounts those high-growth payments back to present value. It then calculates the terminal value using the 4 percent perpetual rate.
Final Result:
- Intrinsic Value: $29.61
- Max Buy Price: $23.69
- State: Undervalued (Hold/Watch)
Meaning:
The mathematical worth is $29.61. The current market price of $25.00 makes the stock objectively cheap. It still fails to meet the strict $23.69 maximum buy target. An investor should wait for a slight price drop before buying.
Accuracy and Method Behind the Gordon Growth Model Calculator
This valuation engine strictly follows the financial mathematics developed by Myron J. Gordon in 1956. It acts as an institutional-grade screener for value investors. The system automatically converts historical dividends into expected next-year payouts and enforces strict mathematical boundaries to prevent broken or infinite valuations on your screen.
Key Features & Benefits
- Instantly spots mispriced assets hiding in the volatile stock market.
- Automatically isolates constant dividend yield from capital gains growth.
- Calculates exact maximum buy prices using your strict safety margin.
- Extracts the precise dividend growth rate implied by current market prices.
- Supports multi-stage discounting for companies transitioning to terminal maturity.
Technical Process
Data Capture
The system checks your entered dividend and percentage rates to validate inputs before executing the mathematical equations.
Valuation Processing
The algorithm calculates the future dividend streams and subtracts perpetual growth from your required rate of return.
Output Generation
The dashboard displays your final intrinsic stock value alongside contextual safety margins and interactive return ring visualizers.
How the Gordon Growth Model Formula Works (Complete Breakdown)
The Gordon Growth Model Calculator evaluates a stock’s true worth by discounting infinite future dividend payments into a single present value. This financial formula helps value investors spot mispriced assets immediately. It also extracts the exact implied growth rate currently expected by the stock market.
The Valuation Formulas
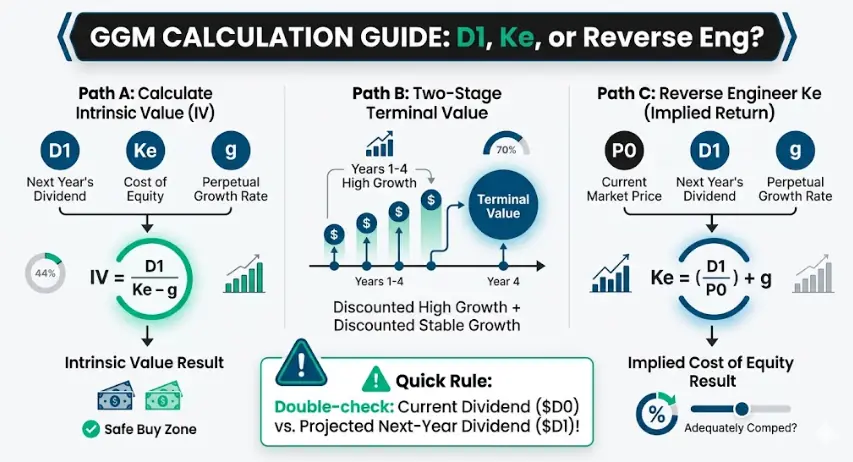
					Constant Growth: IV = D1 / (Ke - g)
Expected Dividend: D1 = D0 * (1 + g)
Two-Stage Growth: IV = (PV of High-Growth Dividends) + (PV of Terminal Value)
Reverse Implied Growth: g = Ke - (D1 / Price)
These mathematical equations calculate a stock’s true worth based on future cash generation. The primary function divides next year’s expected dividend by the spread between your required return and perpetual growth. Reversing the equation isolates the exact growth percentage necessary to justify a stock’s current trading price.
What Each Variable Means
Every Gordon Growth Model calculation relies on a few core inputs. Here is exactly what each variable means and how it affects your final valuation.
IV (Intrinsic Value)
The fair mathematical price of the stock today appears here. Investors use this calculated baseline to determine if a share is overvalued or undervalued before risking any capital.
D1 (Expected Dividend)
Your anticipated cash payment per share over the next 12 months forms the formula’s numerator. The model uses this forward-looking projection to accurately value all upcoming cash flows.
D0 (Current Dividend)
Total dividends paid over the trailing 12 months provide your starting baseline. Our system multiplies this recent historical payout by your expected growth rate to estimate future distributions.
Ke (Cost of Equity)
Required annual returns justify the risk of holding a specific stock. Investors typically calculate this baseline using the Capital Asset Pricing Model (CAPM), which factors in the current risk-free rate and the stock’s historical volatility (beta).
g (Growth Rate)
The constant, perpetual speed at which a company increases its dividend payout defines this metric. Your estimated percentage must remain strictly lower than the cost of equity for the math to work properly.
High Growth Phase
The temporary, accelerated rate at which dividends will increase before the company reaches full maturity. This only applies during a Two-Stage valuation.
Terminal Growth Rate
The permanent, lower rate at which the company will grow forever after the high-growth phase ends.
Another Example Calculation (Step-by-Step)
Let us calculate the intrinsic value of a stable telecommunications company. This example follows the exact mathematical steps used inside our constant growth calculator.
Given:
- Current Dividend Paid (D0) = $3.00
- Cost of Equity (Ke) = 12%
- Growth Rate (g) = 4%
Calculation:
					D1 = 3.00 * (1 + 0.04) = 3.12
Intrinsic Value = 3.12 / (0.12 - 0.04) = 39.00
The system first converts your past dividend into next year’s expected payment. It then divides that $3.12 future payment by the 8 percent spread between your required return and perpetual growth.
Result:
- Expected Dividend (D1): $3.12
- Intrinsic Value: $39.00
Meaning:
This telecom stock is mathematically worth $39.00 per share. You can safely purchase shares if the current market price sits below this valuation threshold. If the market charges $45.00 for this stock, it is completely overvalued and mathematically incapable of delivering your required 12 percent return.
How do you calculate the Gordon Growth Model?
Calculate the Gordon Growth Model by dividing the expected next-year dividend by the difference between your cost of equity and the perpetual growth rate. The core formula is IV = D1 / (Ke – g). This tells you exactly what a stock is mathematically worth today.
What is the intrinsic value of a mature bank stock?
A dividend investor evaluates a national bank with a steady historical payout and a current trading price of $80.00.
Use these inputs in the calculator:
Valuation Model = Constant Growth | Dividend Just Paid ($D_0$) = $4.50 | Cost of Equity = 8% | Growth Rate = 3% | Margin of Safety = 10%
Process:
The system estimates next year’s dividend at $4.64. It divides this expected payout by the 5 percent spread between the required return and growth rate.
Result:
- Intrinsic Value = $92.70.
- Max Buy Price = $83.43
Meaning:
The $80.00 market price falls safely below the strict $83.43 safety threshold. The investor can comfortably buy the stock without overpaying.
How do you calculate terminal value for a two-stage growth company?
An equity researcher models a software firm transitioning from rapid expansion into a stable, mature business.
Use these inputs in the calculator:
Valuation Model = Two-Stage Growth | Dividend Just Paid ($D_0$) = $1.00 | Cost of Equity = 10% | High Growth Phase = 12% | Duration = 4 Years | Terminal Growth = 4%
Process:
The tool calculates the present value of the first four years of high-growth dividends. It then adds the discounted terminal value for all perpetual years afterward.
Result:
- Intrinsic Value = $22.81.
Meaning:
The stock’s true fair value sits precisely at $22.81. Any market price above this number means investors are paying too much for the temporary high-growth phase.
How do you find the implied cost of equity for a REIT?
A real estate analyst checks if a property trust trading at $50.00 offers enough return to justify the risk.
Use these inputs in the calculator:
Valuation Model = Reverse Engineer | Find = Cost of Equity (Ke) | Expected Dividend ($D_1$) = $2.50 | Growth Rate = 4% | Current Price = $50.00
Process:
The calculator divides the $2.50 dividend by the $50.00 price to isolate a 5 percent dividend yield. It adds the 4 percent growth rate to find the total required return.
Result:
- Implied Cost of Equity (Ke) = 9.00%.
Meaning:
Buying at $50.00 mathematically locks in a 9 percent annual return. The analyst must decide if 9 percent adequately compensates for the sector’s current market risk.
Quick rule to remember
Always double-check whether you are entering a past dividend or a future projection. A small input error here drastically changes your final valuation. Plug your own target stock numbers into the tool above to see your exact safety margins instantly.
Gordon Growth Model Result Benchmarks Explained
Your calculated intrinsic value is not just a theoretical number. It serves as a strict financial boundary for your investment decisions. Compare your final result against the current stock price to quickly determine if a dividend-paying asset is safe to buy.
| Market Condition | Valuation Category | Financial Meaning | Market Context | Action Plan |
|---|---|---|---|---|
| Price < Buy Target | Undervalued (Buy) | The stock trades below its mathematical worth. | Meets your strict margin of safety criteria. | Strong buying opportunity. |
| Buy Target < Price < IV | Hold / Watch | Mathematically cheap but lacks a safety buffer. | Does not provide enough downside protection. | Wait for a market dip. |
| Price > IV | Overvalued (Sell) | Market price exceeds actual cash flow value. | The market prices in unrealistic growth expectations. | Avoid buying or sell shares. |
Heads-up: Growth rate expectations vary heavily by industry. Always compare a stock against its direct market competitors.
Understanding Your Valuation Tier
Finding a stock trading completely below your strict buy target is rare but highly profitable. Most popular dividend stocks will show up as overvalued because market hype artificially inflates their share prices. Sticking to these strict mathematical tiers protects your capital from severe market corrections.
Pro Tip
Never ignore the margin of safety. Applying a 15 to 20 percent discount to your final intrinsic value protects your portfolio if a company suddenly cuts its dividend payout or slows its future growth.
What to Do After Using the Gordon Growth Model Calculator
Your calculated intrinsic value is only helpful if it guides your portfolio decisions. You must now use this number to buy underpriced assets, avoid dangerous dividend traps, and verify market expectations. The financial actions below will help you protect your capital based directly on your valuation results.
For Undervalued Stocks
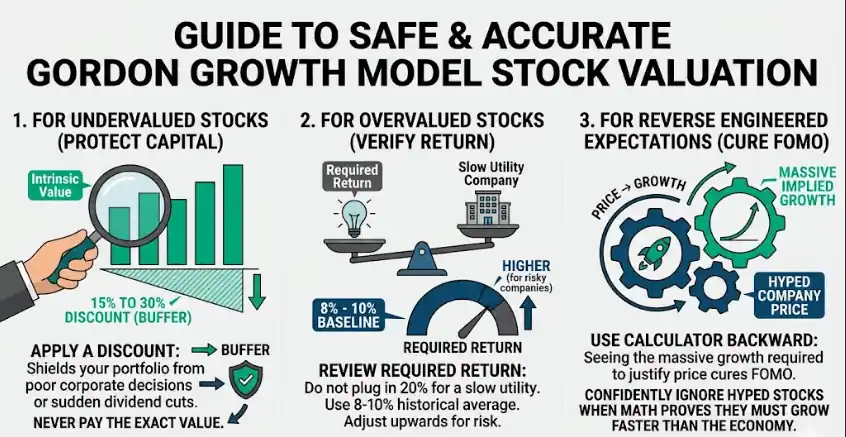
Never pay the exact intrinsic value for a share. Your future dividend estimates will never be perfectly accurate. Applying a 15 to 30 percent discount protects your capital against unexpected economic downturns. This strict buffer shields your portfolio from poor corporate management decisions or sudden dividend cuts.
For Overvalued Stocks
Review your required return before completely abandoning an expensive stock. Do not plug in a 20 percent required return for a slow utility company. Use historical market averages around 8 to 10 percent as your baseline. Adjust this metric slightly upward only for riskier companies to see if the valuation reaches a safe buying zone.
For Reverse Engineered Expectations
Use the calculator backward on expensive or hyped companies. Seeing the massive implied growth rate required to justify their current stock price will quickly cure your fear of missing out. You can confidently ignore popular stocks when the math proves they must grow faster than the entire economy forever just to break even.
You Might Also Find These Helpful
Corporate Finance 6
No tools published here yet.
Related Tools People Use Next
Common Mistakes When Using the Gordon Growth Model Calculator
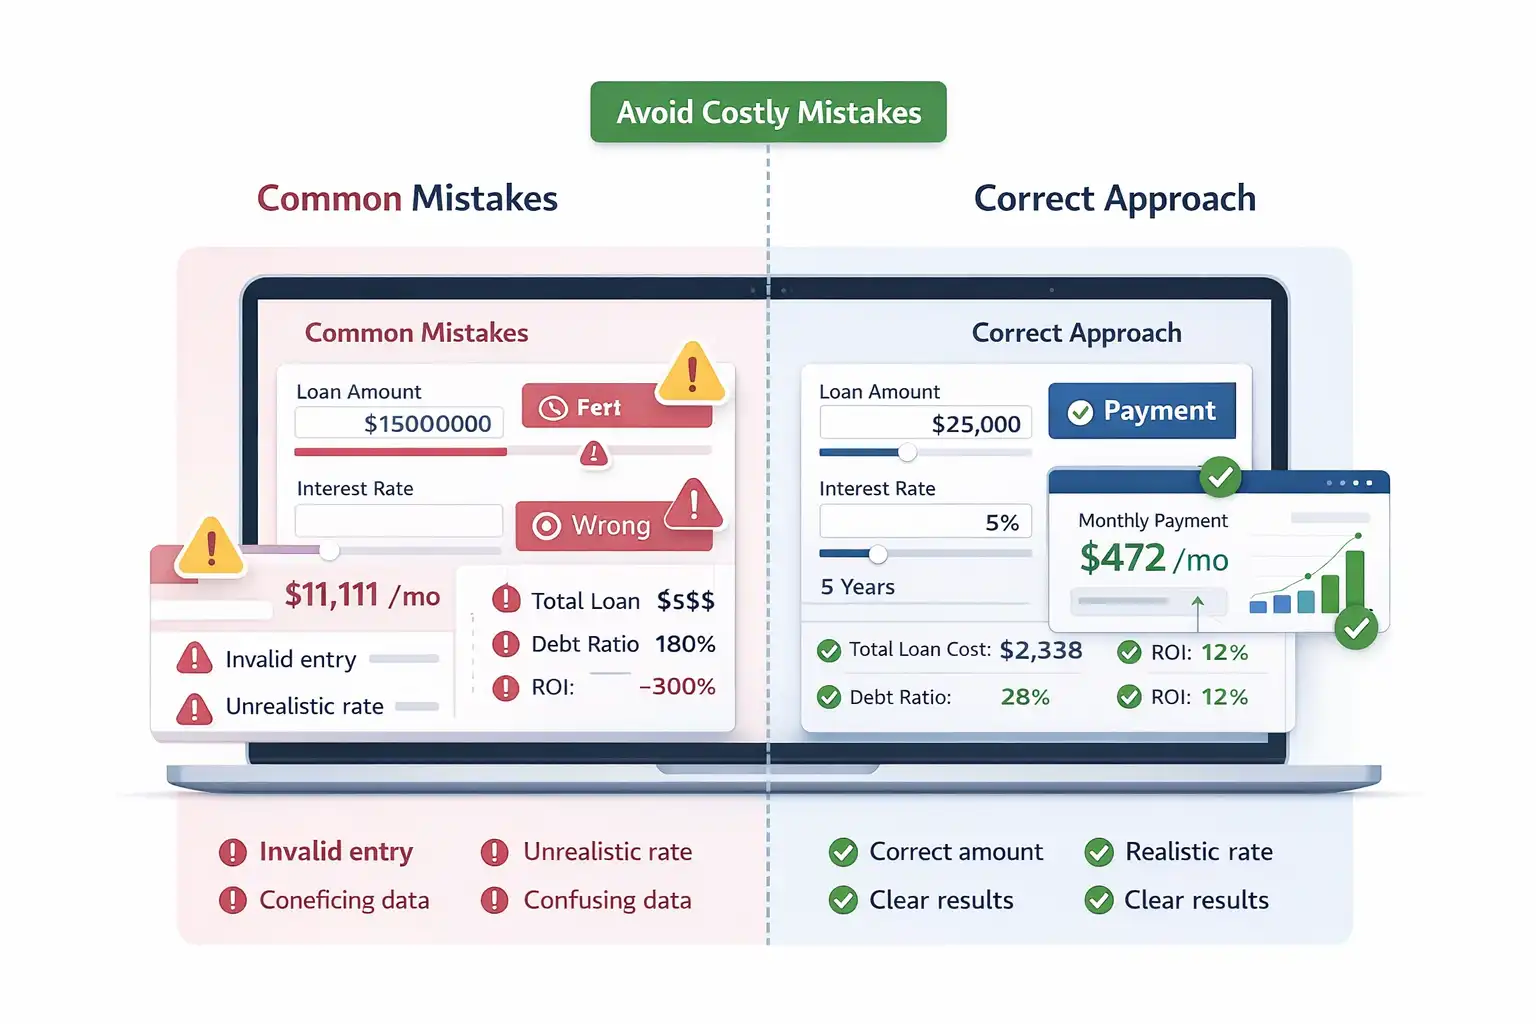
Small input errors quickly distort your stock valuation. Many investors miscalculate their intrinsic value by entering the wrong dividend type or setting unrealistic expansion expectations. Review these frequent modeling errors to ensure your final target price reflects true financial reality.
- Using the recently paid historical dividend instead of the expected next-year payout.
- Entering a perpetual growth rate that equals or exceeds your required cost of equity.
- Assuming a company can increase its dividend at double-digit rates forever against macroeconomic reality.
- Applying this specific discount model to high-growth technology companies that retain all their cash earnings.
- Trusting the final mathematical value blindly without applying a strict margin of safety discount.
Frequently Asked Questions (FAQs)
Why must the required return be higher than the growth rate?
If the perpetual growth rate equals or exceeds your required return, the formula breaks and produces a negative or infinite number. A single company cannot mathematically grow faster than the global economy forever. Attempting to calculate this creates an impossible valuation.
Can I use this model on stocks that do not pay dividends?
No. The classic Gordon Growth equation relies entirely on cash dividend payments to determine a stock’s intrinsic value. If a company retains all its earnings for internal expansion, you must use a Discounted Cash Flow (DCF) model instead to measure its worth.
How do you estimate a realistic dividend growth rate?
Investors usually look at the company’s historical dividend increases over the past ten years to find a baseline average. You can also calculate the sustainable growth rate by multiplying the return on equity by the firm’s retention ratio.
Always keep this estimate conservative to avoid overvaluing the asset.
When should you use the two-stage growth model?
You use the two-stage model for companies currently experiencing temporary, rapid expansion that cannot last forever. It calculates the value of an initial high-growth phase before applying a lower, permanent terminal growth rate.
This creates a much more realistic valuation for transitioning businesses.
How do rising interest rates affect a stock's intrinsic value?
Rising interest rates increase your required rate of return, which makes the formula’s denominator larger. This mathematically drives down the stock’s calculated intrinsic value. Higher risk-free rates make future dividend payments less attractive, forcing the current stock price to drop.
Is the Gordon Growth Model accurate for tech stocks?
It is usually inaccurate for modern tech stocks because they prioritize rapid expansion and share buybacks over steady cash payouts. The mathematical model works best for mature, slow-growing companies like utilities, consumer staples, and established real estate investment trusts.
Questions?
We had love to hear from you! Whether you are reporting an issue, suggesting a new calculator, or exploring collaboration opportunities — we are here to help. Every message helps us make 100calc smarter, faster, and more helpful for everyone.
Why People Trust 100calc
At 100calc.com, we focus on accuracy, speed, and trust. Every calculator we create is designed to give reliable, instant, and easy-to-understand results you can truly depend on.