Marginal Cost Function Calculator (Cost Per Unit Instantly)
A marginal cost function calculator helps you find the cost of producing one extra unit using change in total cost and output. Enter your values, and the tool calculates cost per unit instantly so you can make better pricing and production decisions.
Most people calculate marginal cost wrong. Small errors in cost or quantity can lead to bad pricing and lost profit. That is why simple formulas often fail in real scenarios.
This calculator removes that risk. You get clear results, real cost insights, and a direct view of how production changes affect your business decisions.
Quick Facts
- Uses ΔTC ÷ ΔQ method
- Works for business, economics, and calculus
- Supports real production data
- Instant result with no setup
- Helps compare cost per unit
- Updated Jun 16, 2026
- Reviewed by 100Calc Research Team
Marginal Cost Function Calculator: Unit Cost
First, you can instantly predict your exact unit production cost. Next, you must enter all your specific manufacturing details. Consequently, the digital tool safely processes your exact cost change. Furthermore, you will discover your exact production efficiency perfectly. Finally, the system generates your exact marginal cost numbers directly on your screen safely.
Explore More Calculators
Calculate price elasticity of demand instantly using the midpoint formula. Get accurate PED score, revenue impact, and real examples in seconds.
Try calculatorFind your true cost per unit in seconds. This Average Variable Cost Calculator shows your pricing floor and warns when each sale starts losing…
Try calculatorUse the Comparative Advantage Calculator to compare opportunity costs, find who should specialize, and avoid the table mistakes that flip answers.
Try calculatorUse this cross price elasticity calculator to see if products are substitutes or complements. Get instant results, % changes, and clear market insights in…
Try calculatorUse this High Low Method Calculator to find variable cost per unit, fixed cost, and projected total cost fast for budgeting, pricing, and planning.
Try calculatorUse this marginal revenue calculator to find profit per unit fast. Compare cost, revenue, and output to make smarter pricing decisions instantly.
Try calculatorExplore Related Tools
How to Calculate Marginal Cost From a Table With Real Examples
Before using your own production data, it helps to test the calculator with worked examples. The cases below show how change in total cost and change in quantity turn into a clear marginal cost result. That makes it easier to understand cost per additional unit, production efficiency, and pricing decisions in real business situations.
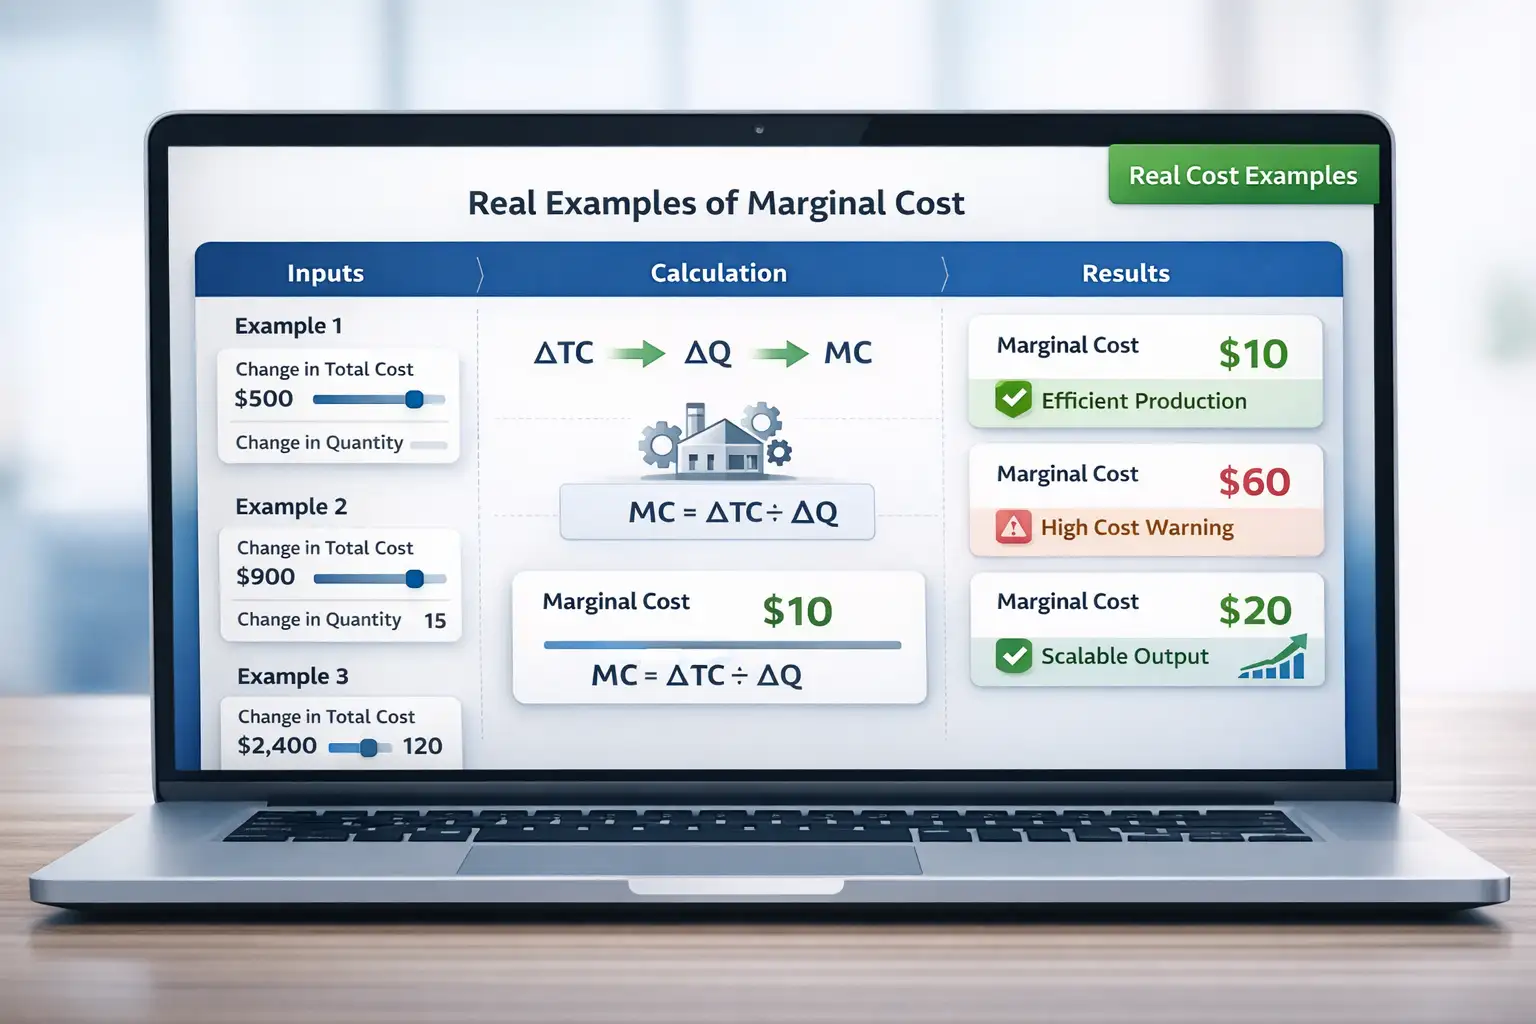
What happens when total cost rises by $500 and output increases by 50 units?
This is a simple marginal cost example for a steady production run. It shows how much each extra unit costs when output expands at a controlled pace.
Use these inputs in the calculator:
- Select Market: United States ($)
- Change in Total Cost: 500
- Change in Quantity: 50
Expected output:
- Marginal Cost: $10.00
- Cost Change: $500
- Change in Cost: $500
- Change in Qty: 50 Units
- Marginal Cost Stat: $10.00
- Status: VERIFIED
Expected interpretation:
Each additional unit costs $10.00 to produce. If your selling price stays above that number, expansion still supports profit.
How is marginal cost calculated when cost rises by ₹1,200 and quantity rises by 30 units?
This case helps readers see how the same formula works in another market. It is also a strong test for the currency-switching feature inside the calculator.
Use these inputs in the calculator:
- Select Market: India (₹)
- Change in Total Cost: 1200
- Change in Quantity: 30
Expected output:
- Marginal Cost: ₹40.00
- Cost Change: ₹1,200
- Change in Cost: ₹1,200
- Change in Qty: 30 Units
- Marginal Cost Stat: ₹40.00
- Status: VERIFIED
Expected interpretation:
The business spends ₹40.00 for each extra unit produced. A selling price below that level would create pressure on margins.
What does a higher marginal cost look like when cost increases by £900 and output rises by only 15 units?
A slower output gain with a large cost jump usually creates a higher marginal cost. That can signal declining efficiency or expensive production inputs.
Use these inputs in the calculator:
- Select Market: United Kingdom (£)
- Change in Total Cost: 900
- Change in Quantity: 15
Expected output:
- Marginal Cost: £60.00
- Cost Change: £900
- Change in Cost: £900
- Change in Qty: 15 Units
- Marginal Cost Stat: £60.00
- Status: VERIFIED
Expected interpretation:
Each additional unit now costs £60.00. That is a warning sign if market price is not rising at the same pace.
How to calculate marginal cost from a table when cost changes by ₨2,400 and quantity changes by 120 units?
This is a useful table-style example because the cost and quantity values are clean and easy to verify. It works well for students, analysts, and businesses checking bulk production.
Use these inputs in the calculator:
- Select Market: Pakistan (₨)
- Change in Total Cost: 2400
- Change in Quantity: 120
Expected output:
- Marginal Cost: ₨20.00
- Cost Change: ₨2,400
- Change in Cost: ₨2,400
- Change in Qty: 120 Units
- Marginal Cost Stat: ₨20.00
- Status: VERIFIED
Expected interpretation:
The marginal cost is ₨20.00 per extra unit. That points to efficient scaling because the added cost stays low across a larger production increase.
What result should you expect when cost rises by د.إ750 and quantity rises by 25 units?
This case is helpful for checking a mid-range production scenario. It also confirms that the calculator handles another regional currency correctly.
Use these inputs in the calculator:
- Select Market: UAE (د.إ)
- Change in Total Cost: 750
- Change in Quantity: 25
Expected output:
- Marginal Cost: د.إ30.00
- Cost Change: د.إ750
- Change in Cost: د.إ750
- Change in Qty: 25 Units
- Marginal Cost Stat: د.إ30.00
- Status: VERIFIED
Expected interpretation:
Each new unit adds د.إ30.00 in cost. That gives a clear break-even reference for pricing and production planning.
How do these examples help you understand the marginal cost function?
These examples show the core logic behind a marginal cost function calculator without making the page feel too technical. Once you know the change in total cost and the change in quantity, you can test efficiency, compare production runs, and see how cost behaves as output expands.
How Should You Read Marginal Cost Results Before Increasing Production?
Marginal cost tells you how much each extra unit adds to total production cost. That number becomes useful when you compare it with price, output growth, and efficiency. Use this table to decide whether expanding production makes sense, whether costs are rising too fast, or whether margins need closer review.
| Method | Best for | Accuracy level | Smart Note |
|---|---|---|---|
| Low Marginal Cost | Efficient scaling and bulk production | High | Each extra unit stays affordable. Expansion is easier when selling price remains above cost. |
| Stable Marginal Cost | Consistent output planning | Balanced | Costs are predictable across added units. This supports steady pricing and production control. |
| Rising Marginal Cost | Margin review and pricing checks | Critical | Each new unit costs more than the last. Profit can shrink quickly if selling price does not adjust. |
| Very High Marginal Cost | Loss prevention and output limits | Critical | Production may be too expensive at this level. Review labor, materials, and capacity before adding more units. |
Smart note: If marginal cost changes sharply across small output increases, test several quantity scenarios. Input costs, production limits, and pricing pressure can all shift the result.
What Your Marginal Cost Result Means
First, our Marginal Cost Function Calculator determines your exact unit production expense safely. Next, you might wonder what your specific numbers mean completely. Consequently, your final result protects your corporate revenue perfectly. Therefore, you easily discover your true production efficiency safely. Ultimately, we break down your exact cost score and expense changes below completely.
Understanding Your Marginal Cost Score
First, you must identify your customers’ actual reactions to ensure safe inventory planning. Next, a smart manager uses the exact mathematical score to avoid losing buyers safely. Furthermore, the final coefficient sets your true market boundary perfectly. Consequently, you can safely measure the exact sales shift from external price changes. Therefore, you use your exact demand score to set safe revenue goals.
Production Efficiency vs Loss
First, you deserve a clear picture of the safety risks in your factory. Next, our digital tool features a special efficiency tracker perfectly. Furthermore, keeping your selling price above the marginal cost ensures profit completely. Consequently, comparing unit costs to market prices creates a highly accurate wealth report safely. Ultimately, the adjusted data reflect your true financial growth perfectly when you calculate marginal cost correctly.

Result Breakdown:
- Cost Per Additional Unit: First, we display your exact production cost completely. Next, the specific value reveals how much one extra unit costs safely. Consequently, you instantly know your exact manufacturing limit perfectly.
- Total Expense Delta: The digital tool also shows your total wealth shift in a safe way. Next, smart managers use the exact number to fully understand broad production growth.
- Strategic Market Analysis: Finally, we explain exactly how you should adjust future production perfectly. Consequently, you understand exactly how your new run performs safely at current prices.
How to Use the Marginal Cost Function Calculator
This marginal cost function calculator helps you find the cost per additional unit using real production data. It uses change in total cost and change in quantity to deliver fast, accurate results. Follow these steps to measure efficiency, control expenses, and make smarter pricing decisions.
Select Your Target Market Currency
Start by choosing your market from the dropdown. This updates the currency symbol instantly. It also aligns your marginal cost output with real pricing conditions. A localized view helps compare production costs across regions and supports better financial decisions.
Enter the Total Change in Production Costs
Add the difference in total cost after production changes. This includes raw materials, labor, and operational expenses. Accurate cost input is critical because it directly impacts your marginal cost result and overall cost analysis.
Enter the Total Change in Produced Quantity
Input how many additional units were produced. This reflects the output increase between two production levels. A clear quantity change helps calculate cost per unit and reveals how efficiently your business scales production.
Click solve marginal cost
Press the calculate button to apply the marginal cost formula. The tool divides cost change by quantity change instantly. It processes your input using real-time logic and displays precise cost per unit without any delay.
Review your cost result and strategy insight
Results appear with marginal cost, total cost change, and production summary. A lower cost shows efficiency. A higher value signals rising expenses. Compare this number with your selling price to decide whether to scale production or adjust pricing.
Example for testing
First, try these sample numbers to see exactly how the digital tool works completely. Next, you can verify the financial result instantly and safely.
Target Market: United States ($)
Change in Total Cost: $500
Change in Quantity: 50 Units
Result → First, you calculate the exact cost per unit completely. Your total expense grew by $500 safely. Next, you calculate your exact unit change safely. Consequently, your production volume grew by exactly 50 units. Furthermore, the system securely processes the division formula. Your exact unit cost equals exactly ten dollars. Then the tool securely classifies your exact production efficiency.
Finally, enter your own business numbers safely.
How the Marginal Cost Formula Explained (Complete Breakdown)
Marginal cost shows how much it costs to produce one extra unit. This marginal cost function calculator uses the change in total cost and change in quantity to give a precise cost per unit. It helps you evaluate production efficiency, pricing strategy, and profit margins using real business data.
Marginal Cost Formula
					MC = ΔTC ÷ ΔQ

Or in simple term

MC = Change in Total Cost ÷ Change in Quantity
This formula divides the change in total cost by the change in quantity produced. It gives the exact cost required to produce one additional unit.
What Each Variable Represents in the Marginal Cost Function
Each input reflects a real production shift. These values match your calculator fields and support accurate cost analysis.
ΔTC (Change in Total Cost)
This value reflects how much total cost increases or decreases after production changes. It includes raw materials, labor, and operational expenses. A higher cost change signals increased production spending.
ΔQ (Change in Quantity)
This input shows how many additional units were produced. It measures output growth between two production levels. Larger quantity changes often improve cost distribution across units.
MC (Marginal Cost Output)
This result shows the cost of producing one extra unit. It is calculated by dividing cost change by output change. A lower value indicates efficient production, while a higher value signals rising costs or inefficiency.
Why This Marginal Cost Function Matters for Business Decisions
Raw numbers alone do not guide smart decisions. This marginal cost formula reveals how production changes affect cost per unit. That insight helps you adjust pricing, control expenses, and avoid profit loss.
- Detect rising production costs early
- Optimize pricing based on unit cost
- Compare marginal cost with marginal revenue
- Identify inefficient production levels
- Improve cost control in scaling operations
When Should You Use This Marginal Cost Calculator?
Accurate results depend on realistic input data. This tool works best when you have clear cost and production changes.
- Two production levels with cost difference
- Reliable change in total cost data
- Actual or projected output increase
- Manufacturing or service production data
- Cost analysis for pricing or scaling decisions
Business owners, analysts, and students use this method to measure efficiency and make better production decisions
Another Example Calculation (Step-by-Step)
Let’s walk through a fresh example using the same logic as your calculator.
Given:
- Change in Total Cost = 1,200
- Change in Quantity = 80
Calculation:
					Step 1: Identify Cost Change

Total cost increases by 1,200 after scaling production.

Step 2: Identify Output Change

Production increases by 80 units.

Step 3: Apply Marginal Cost Formula

MC = 1,200 ÷ 80 = 15
Result:
- Marginal Cost = 15 per unit
Meaning:
Each additional unit costs 15 to produce. If your selling price is higher than 15, production remains profitable. Lower pricing may reduce margins. Monitoring marginal cost helps maintain efficiency and avoid hidden losses.
Standard Production Cost Benchmarks
First, you might wonder exactly how these manufacturing numbers interact completely. Next, knowing standard unit cost benchmarks provides an important context for production. Consequently, you can instantly evaluate your exact manufacturing risk safely. Furthermore, your final batch choices depend largely on these specific efficiency rules completely. Therefore, we break down standard cost behaviors right here safely. Ultimately, you can safely use our Marginal Cost Function Calculator to perfectly understand your exact unit profit.
| Production State | Cost Behavior | Efficiency Level | Managerial Action |
|---|---|---|---|
| Economies of Scale | Decreasing Unit Cost | High Efficiency | Increase production volume safely. Extra units become cheaper perfectly. |
| Constant Returns | Steady Unit Cost | Stable Output | Maintain current factory runs completely. Costs remain predictable safely. |
| Diminishing Returns | Increasing Unit Cost | Low Efficiency | Stop extra production runs perfectly. Extra units cost too much safely. |
| Breakeven Point | Cost Equals Price | Zero Profit | Review raw material costs completely. You make zero profit safely. |
Note: Next, you must remember your specific final factory profit relies entirely on your exact calculated unit numbers safely.
Interpretation
First, a declining unit cost symbolizes excellent factory health. Next, an increasing unit cost proves your facility suffers from overcrowding. Consequently, your specific inventory planning remains highly protected completely for safe sales. Furthermore, you might have already reached your maximum scaling limit safely. Conversely, a strict production rule is perfectly implemented in every smart manufacturing strategy. Our digital tool shows the exact unit cost instantly. Additionally, many managers want to accurately and safely calculate marginal cost. We include your exact production status for extra context.
Pro Tip:
- Review Batch Sizes: First, try reviewing your exact extra-unit runs right away, safely.
- Adjust Your Tracking: Next, your specific factory condition can completely change your expected cost. Therefore, you must use exact expense inputs immediately and safely.
- Share the Reports: Finally, you can share the confirmed digital results with your operations team perfectly. Consequently, applying the exact mathematical formula ensures you never overproduce units safely.
Tips for Managing Production Efficiency
First, you must carefully and thoroughly plan your manufacturing strategy. Next, smart managers protect their total factory revenue safely. Consequently, you avoid making dangerous production choices perfectly. Furthermore, you can use our Marginal Cost Function Calculator to test new batch runs securely. Ultimately, applying these expert tips guarantees a much safer corporate future.
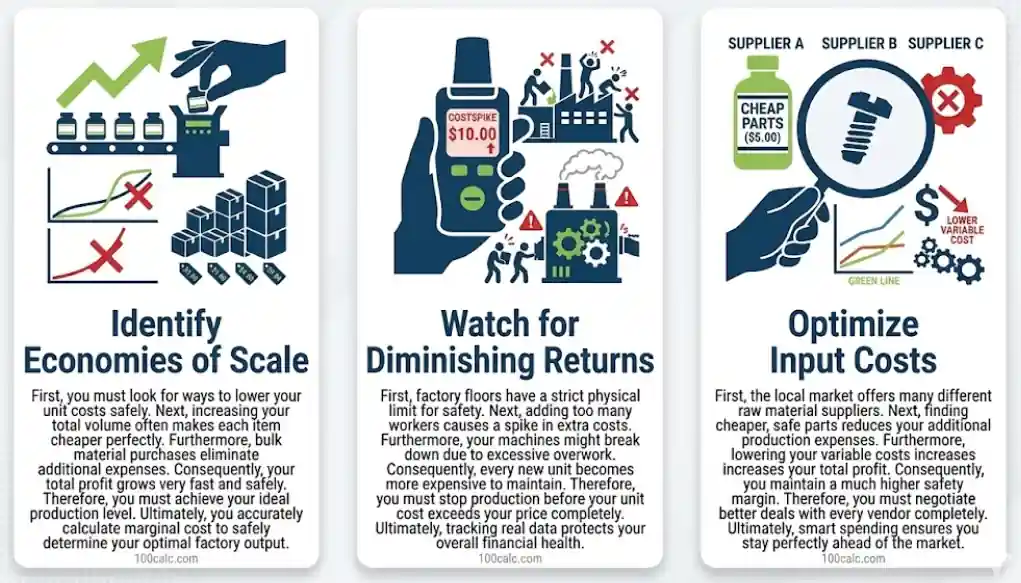
Identify Economies of Scale
Watch for Diminishing Returns
Optimize Input Costs
You Might Also Find These Helpful
Economics 6
No tools published here yet.
Related Tools People Use Next
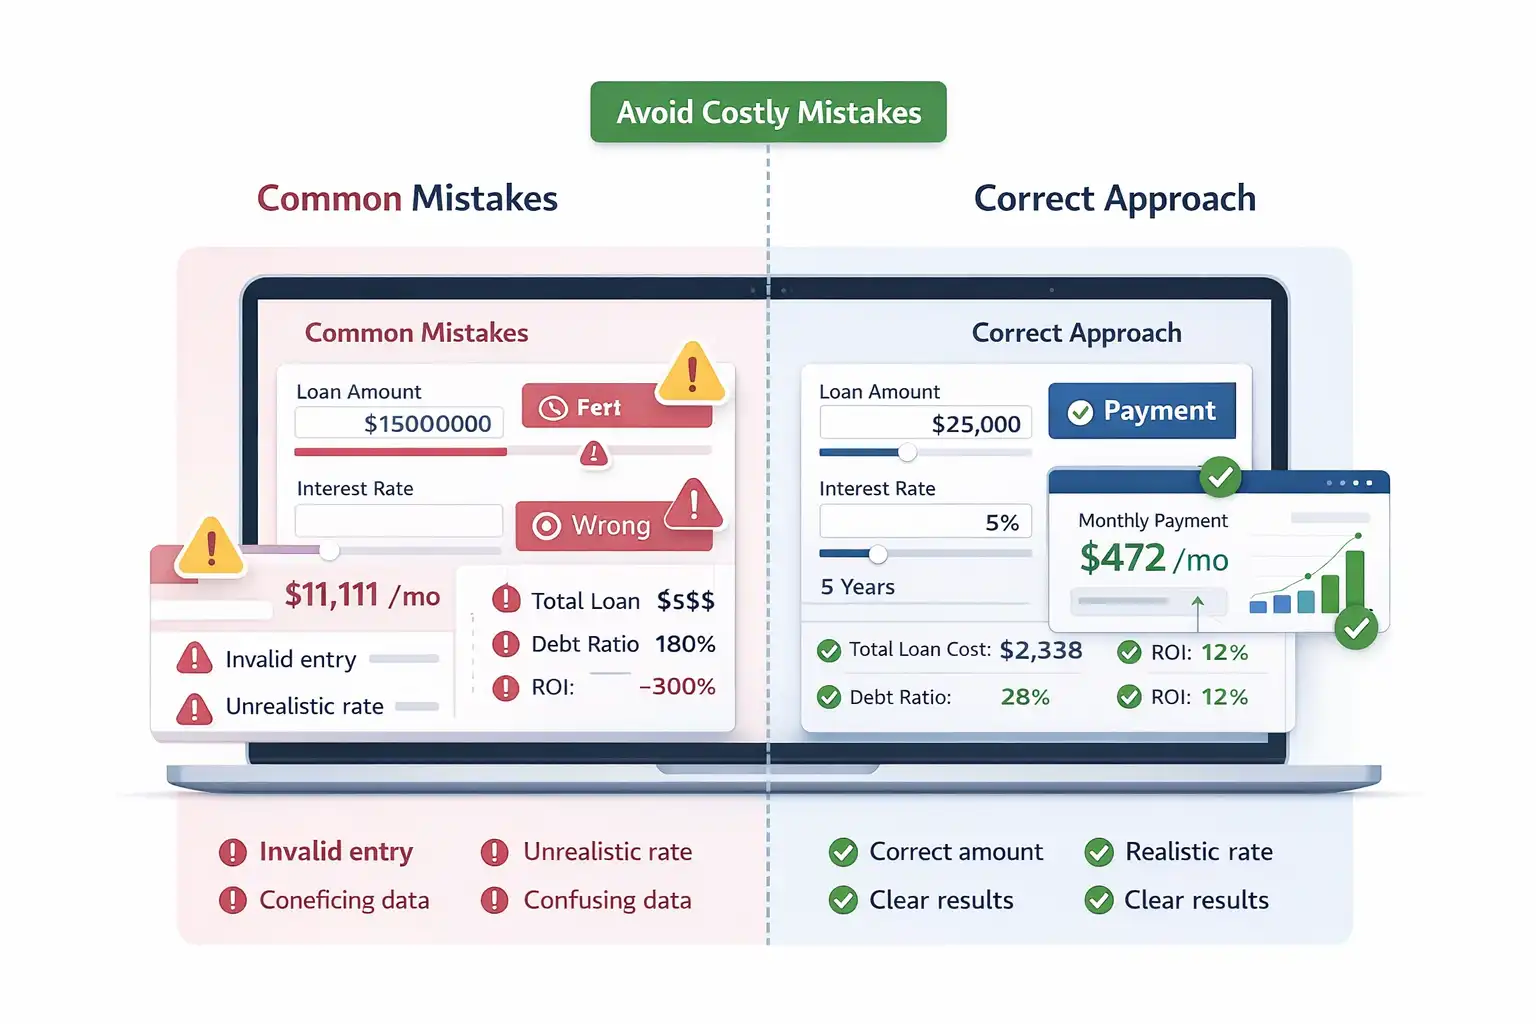
Common Mistakes When Using a Marginal Cost Function Calculator
- Entering total cost instead of change in total cost (ΔTC)
- Using wrong quantity values instead of change in output (ΔQ)
- Ignoring zero or negative quantity which breaks the calculation
- Mixing fixed costs into marginal cost inputs
- Forgetting to compare marginal cost with selling price
- Using estimated data instead of real production numbers
- Misreading results without checking cost efficiency trends
Frequently Asked Questions (FAQs)
How do you find the marginal cost function?
Marginal cost is found by dividing the change in total cost by the change in output. It shows how much each extra unit costs to produce. Use the formula MC = ΔTC ÷ ΔQ to calculate cost per unit based on real production data. A cost function can also be used. In that case, marginal cost is the derivative of total cost with respect to quantity.
What is the MC formula?
The marginal cost formula is MC = ΔTC ÷ ΔQ. It measures the additional cost required to produce one more unit. This formula uses two inputs. Change in total cost and change in quantity. It gives a clear cost per unit value. Accurate inputs lead to better pricing and production decisions.
How is marginal revenue different from marginal cost?
Marginal revenue shows how much extra income each unit generates. Marginal cost shows how much it costs to produce that unit. Profit depends on the gap between these two values. When revenue is higher than cost, production adds profit. When cost exceeds revenue, losses begin to increase.
How do I calculate marginal cost quickly using a calculator?
Enter change in total cost and change in quantity into the calculator. Then click solve. The tool applies the marginal cost formula instantly. Results show cost per unit along with production insights. This method removes manual errors and speeds up decision making.
Can this calculator help if you only have cost table values instead of a full cost function?
Yes. This tool works well when you have table values instead of a full calculus-based cost function. You only need two numbers: the increase in total cost and the increase in quantity. That makes it practical for business use, classroom work, and quick production analysis.
How do you calculate marginal cost and average cost together?
Marginal cost uses change in cost divided by change in quantity. Average cost divides total cost by total output. Both metrics help measure efficiency. Marginal cost shows short-term changes. Average cost shows overall production performance. Comparing both helps identify optimal production levels.
Why is marginal cost important for pricing decisions?
Marginal cost helps businesses decide how much to produce and at what price to sell. It shows the minimum cost required for each unit. Pricing below marginal cost leads to losses. Pricing above it supports profit growth. It also helps track efficiency and cost control.
How do you calculate marginal cost from a table?
Start by identifying two production levels. Then find the difference in total cost and output between those levels. Divide cost change by quantity change. This gives marginal cost per unit. Using table data helps track cost behavior across multiple output levels.
What should readers use next after this marginal cost calculator?
Once users understand marginal cost, the next useful tools are a marginal revenue calculator, an average variable cost calculator, and a broader marginal average cost function calculator. Together, these help compare cost, revenue, and profit per additional unit across the same production decision.
Can marginal cost be zero?
Marginal cost can be close to zero in rare cases. This happens when additional production does not increase cost. Digital products and automated systems often show this pattern. However, most physical production always has some cost per unit. Always verify inputs before assuming zero cost.
What are the main types of cost in economics?
Costs are usually grouped into four types. Fixed cost stays constant. Variable cost changes with output. Total cost combines both. Marginal cost shows the cost of one extra unit. Understanding these categories helps build accurate cost functions and pricing strategies.
When should you increase or reduce production based on marginal cost?
Production should increase when marginal revenue is higher than marginal cost. This means each unit adds profit. Output should decrease when cost rises above revenue. That signals inefficiency. Balancing cost and revenue helps maintain long-term profitability.
Questions?
We had love to hear from you! Whether you are reporting an issue, suggesting a new calculator, or exploring collaboration opportunities — we are here to help. Every message helps us make 100calc smarter, faster, and more helpful for everyone.
Why People Trust 100calc
At 100calc.com, we focus on accuracy, speed, and trust. Every calculator we create is designed to give reliable, instant, and easy-to-understand results you can truly depend on.